Fixed Income Research
Investment Strategy
Bird of Prey Nowhere to be Seen
With spreads largely at all-time lows and sourcing real yield proving problematic, asset allocation is challenging for those with constrained mandates. Flexibility in this environment is key; we are still finding ample value in the market, but much of this is capital, not carry based. Although the RBA will decrease bond purchases, we do not see this as hawkish.
Fixed Income Sub-Asset Allocation Summary
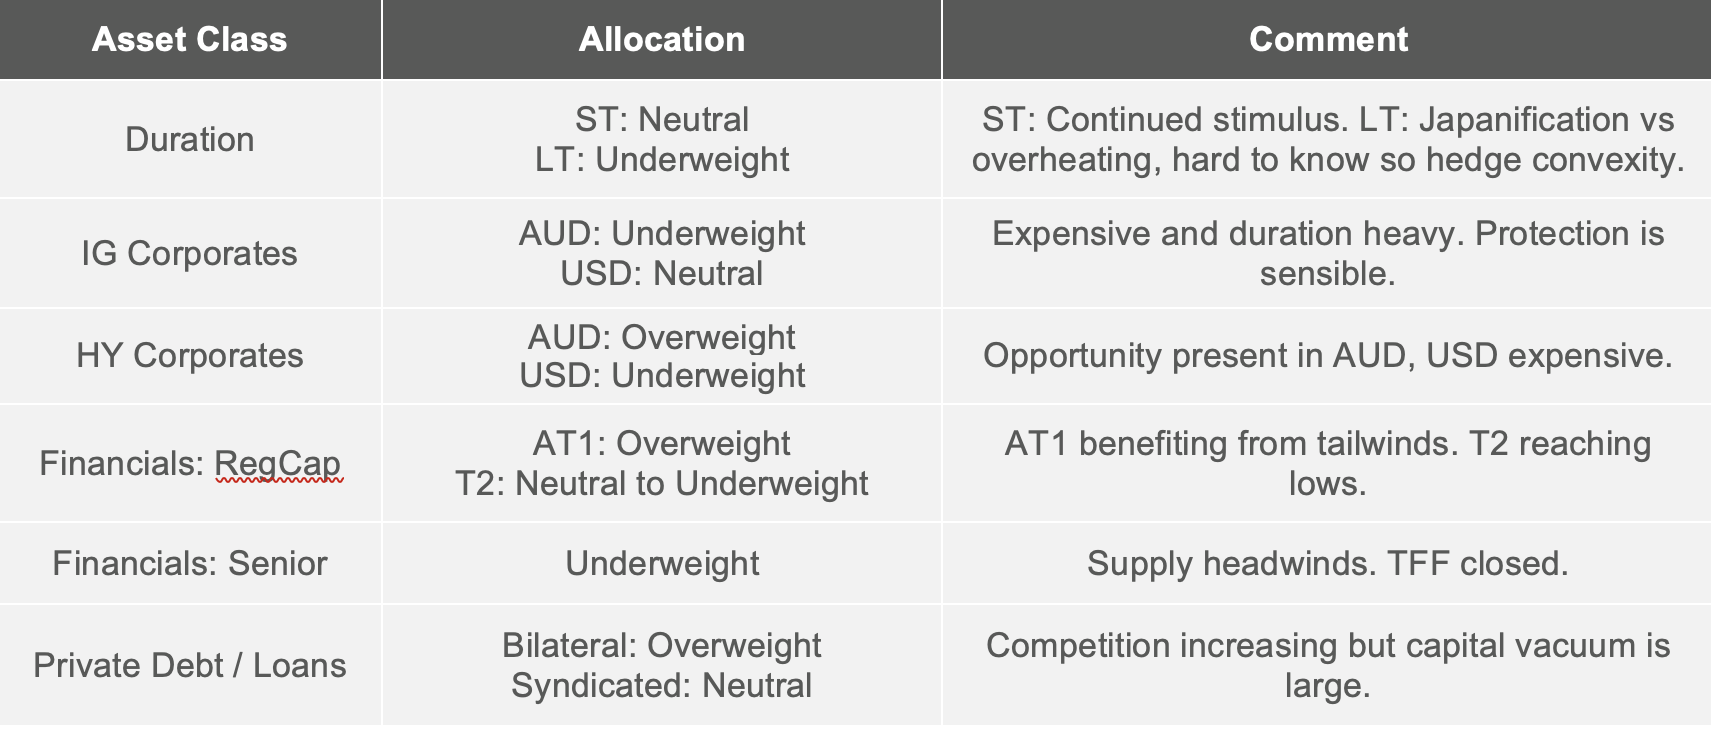 (Figure 1)
Duration
We note an interesting choice of language from RBA’s July meeting, “the Board is responding to stronger-than-expected economic recovery and improved outlook by adjusting the weekly amount (of bonds) purchased”.
In other words, things are better than we thought so we don’t need to buy as many bonds. We take umbrage with this. Australia’s deficit is expected to decrease. Accordingly, less bonds need to be issued. Therefore, less bonds need to be bought on secondary.
Not even considering the conservative nature of the budget forecasts, on a relative basis, we argue that the amount of QE is, at least, staying the same and likely increasing as time passes and the deficit falls. Considering this, has the RBA used the wrong language or is it trying to disguise further accommodation? We think the latter, given that two taper-like events have already occurred that need to be counteracted: (1) the TFF tap being turned off, and (2) the 3-year bond yield target not being pushed out further. By in-effect at least maintaining, if not increasing, the amount of relative purchasing, the RBA is further diverging from developed economies in the midst of recovery.
This narrative is supported by Lowe’s own words, stating “we’re going to keep the stimulus going probably longer than the other countries”. In the short-term we expect to continue to see Aussie weakness and a slowdown or reversal in the flattening trade. The risk here is that the stimulus will run too hot for too long and as illustrated in Figure [2] the Aussie is rarely this cheap with respect to commodity prices.
AUD Index vs Commodity Index
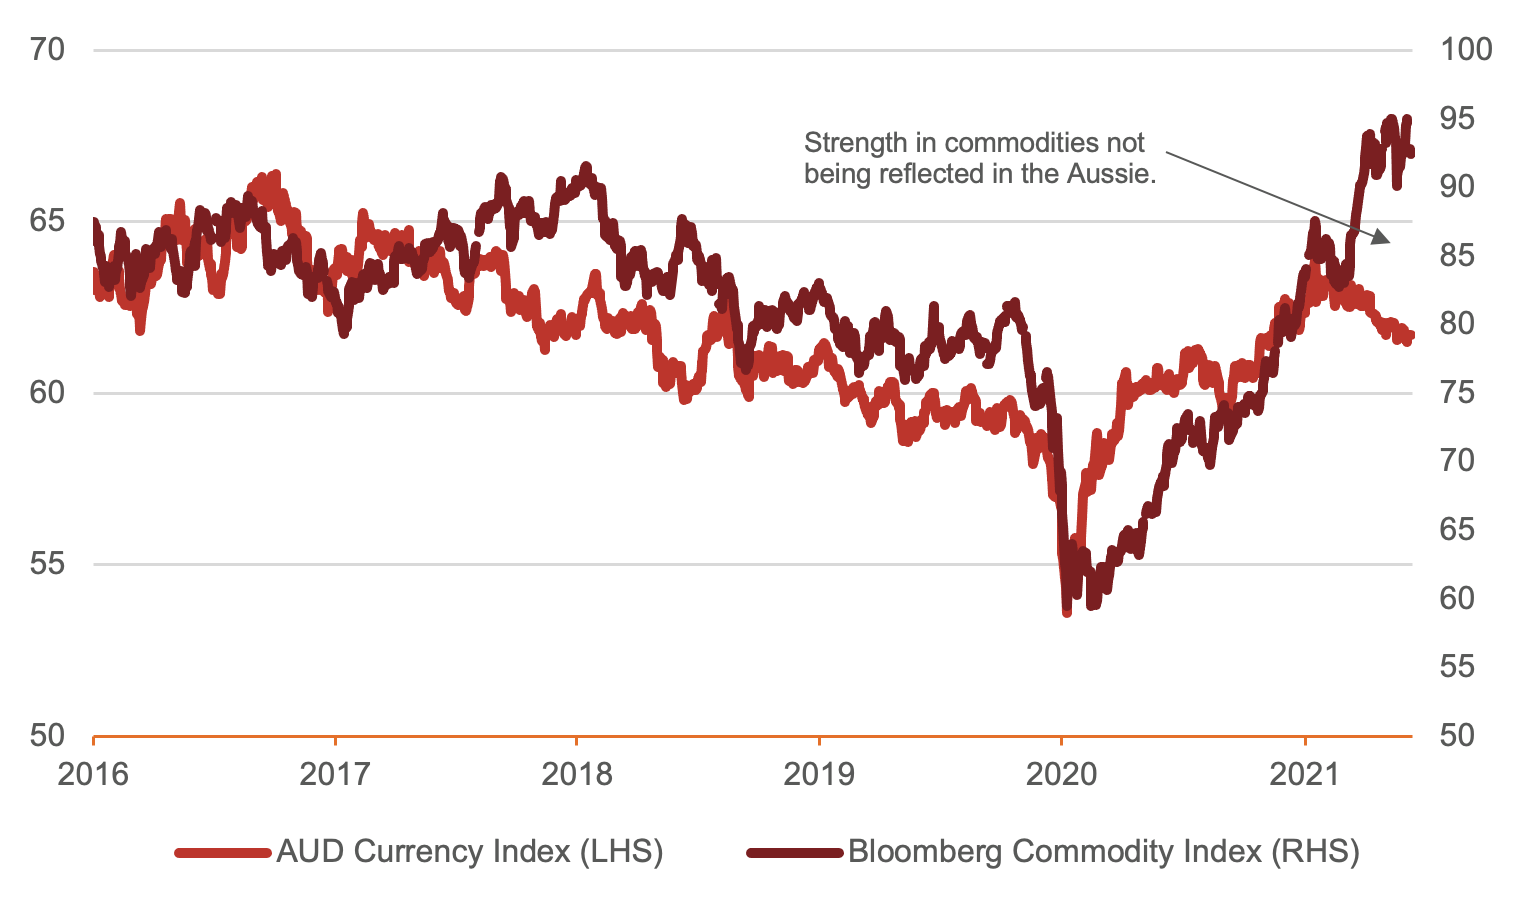 (Figure 2 – Source: BondAdviser, Bloomberg. As at 7 July 2021. )
Given the amount of duration remaining in the system, we remain underweight, as an overheat will be very painful to prices – we prefer floating or hedging fixed bonds with swaps.
The other side of interest rates is that Australia and the US, now having reached the lower bound on unconventional policy, will never be able to unshackle themselves; like Japan and Europe for the past 30 and 10 years, respectively. This is a serious consideration, however with this much stimulus still flowing through the system, it is too early, in our opinion, to make that call.
RBA Bond Purchases – Time Series
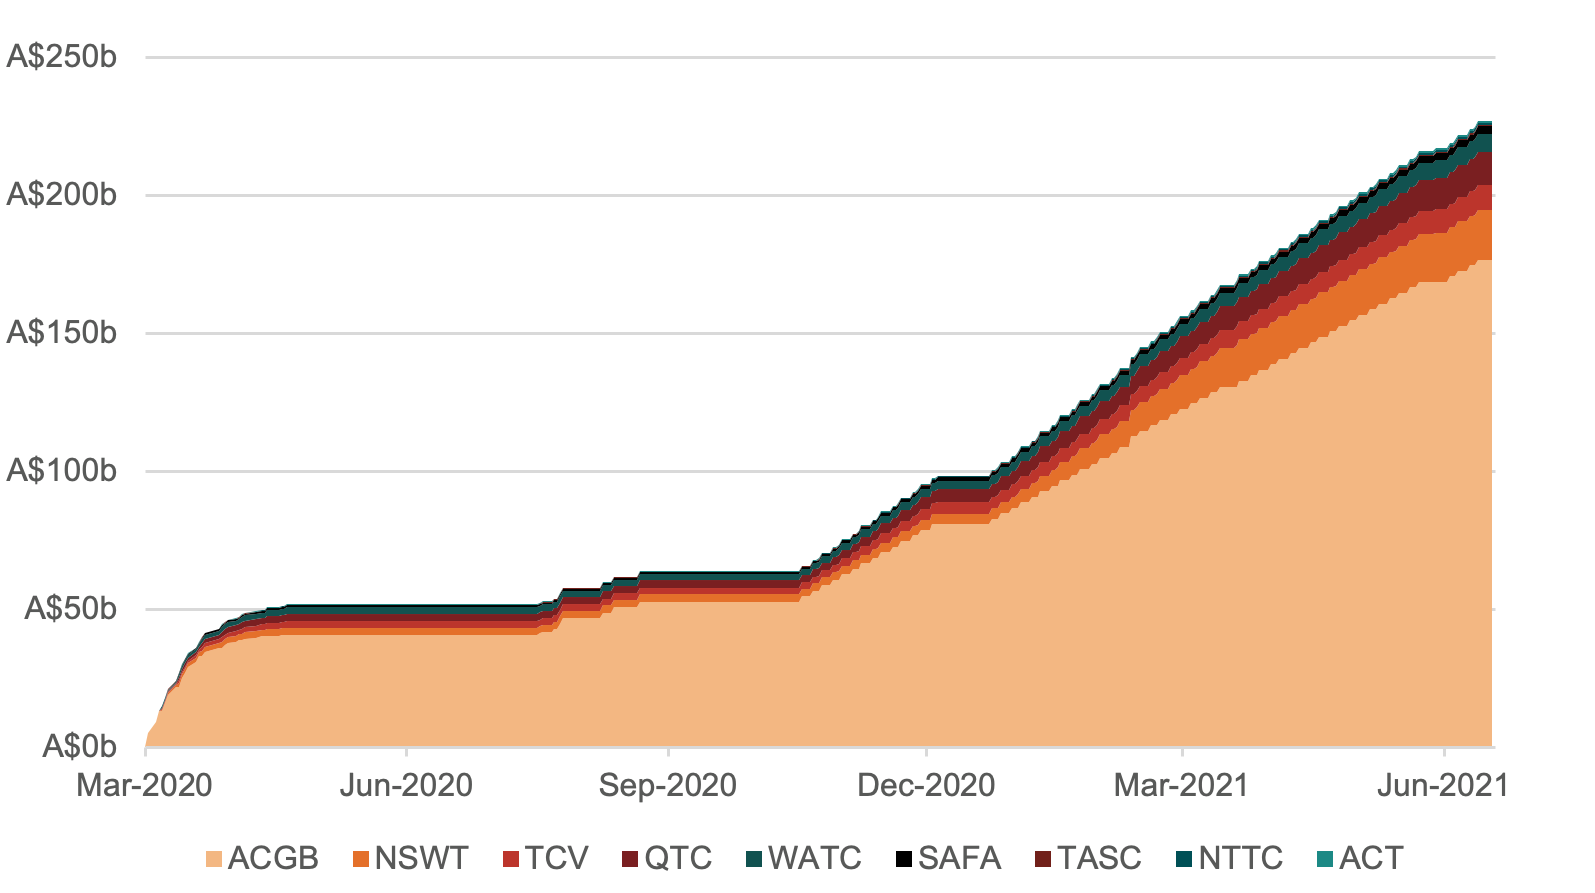 (Figure 3 – Source: BondAdviser, Bloomberg. As at 7 July 2021. )
ACGB – RBA Ownership
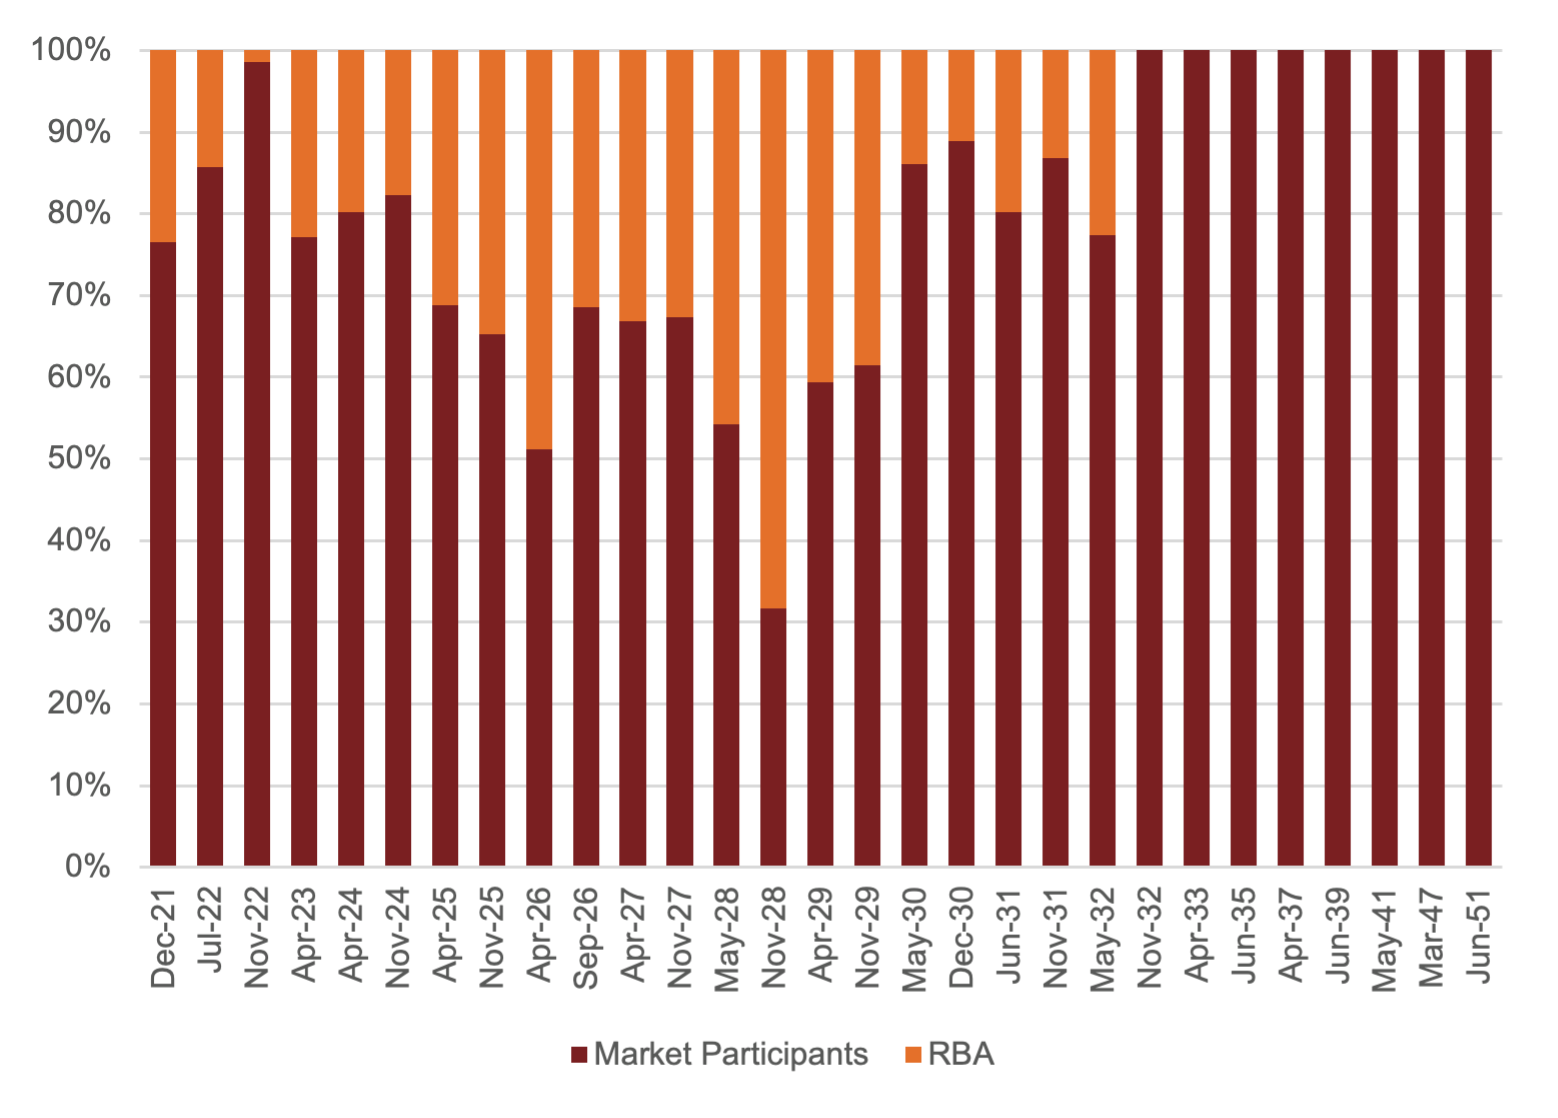
(Figure 4 – Source: BondAdviser, RBA, AOFM, Bloomberg. As at 7 July 2021)
ACGB Change in Yield Curve
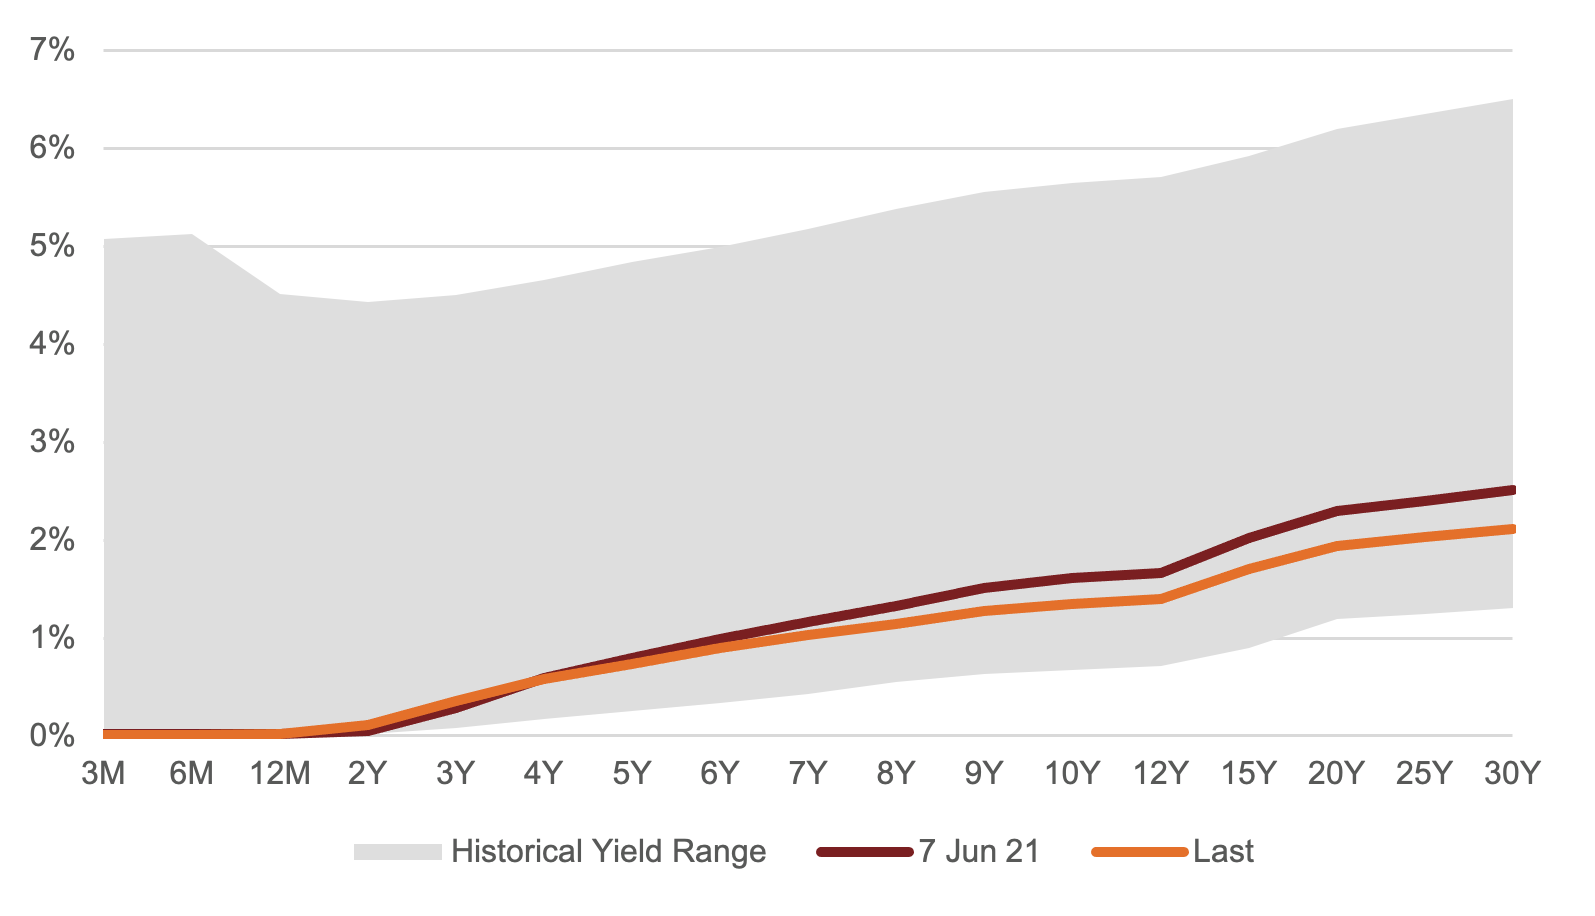
(Figure 5 – Source: BondAdviser, Bloomberg. As at 7 July 2021. )
Looking stateside, we alert readers to the Fed, which two weeks ago, re-priced its reverse repurchase agreement (RRP) facility by 5bps from 0bps. These are small numbers; however, the impact could be large. A RRP rate of 0% provided no real benefit to the banking system besides being a place to park cash. Now at 5bps, hundreds of billions in money markets will storm out of Treasury bills (where bills yield less than 5bps out to 6 months) and into the RRP facility. This is exacerbated with banks draining reserves into the facility. Given banks are now liability contained – in other words, deposits are flowing off – this may create unexpected liquidity issues as was seen in 2019. The increase in overnight reverse repurchase agreements is staggering as seen in Figure [6].
Fed Liabilities Reverse Repurchase Agreements
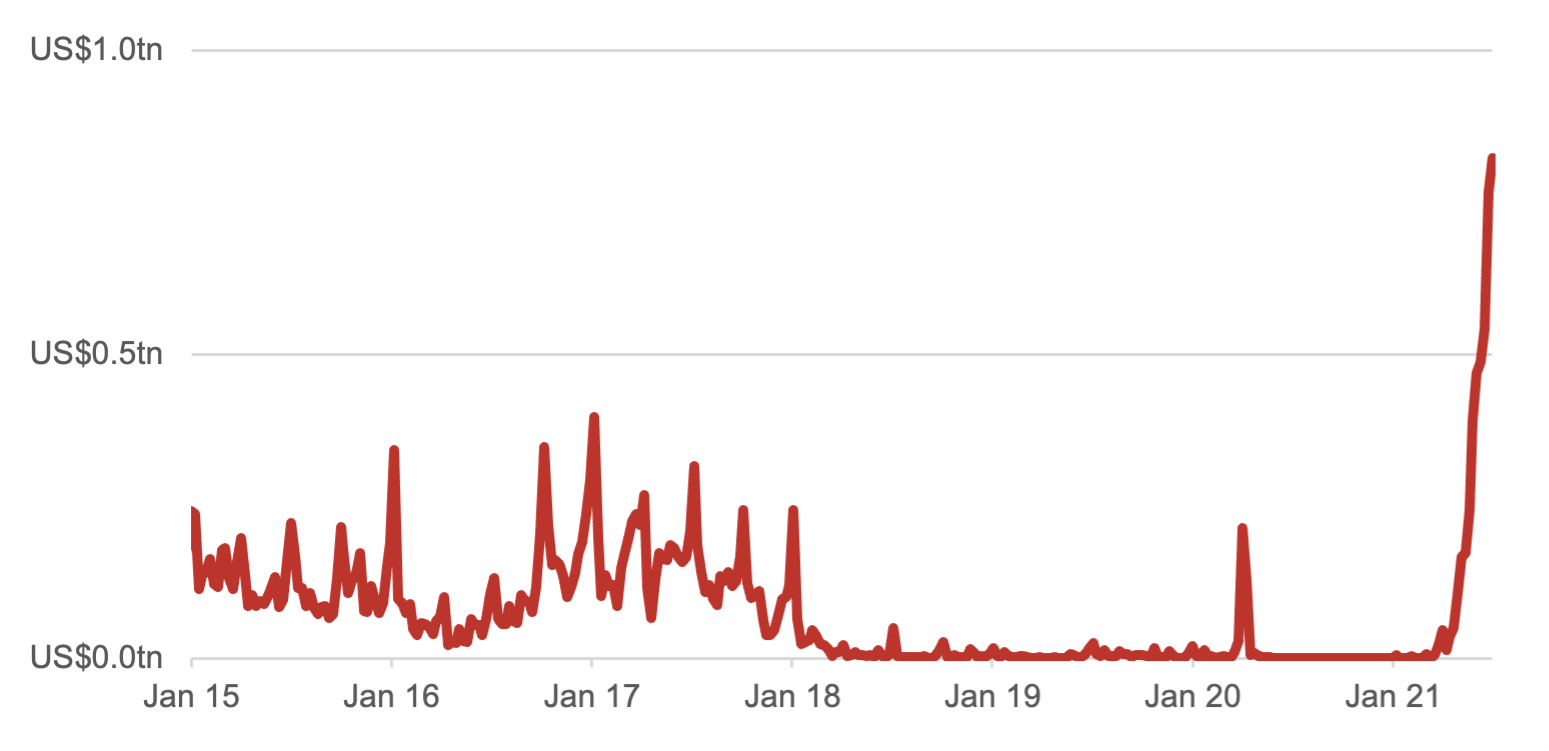
(Figure 6 – Source: BondAdviser, FRED. As at 30 June 2021.)
Investment Grade Corporates
The opportunity cost of investing in bonds can be viewed in many ways. In Figure [x] we show the dividend yield, on an expected and last twelve-month basis, subtracted against the expected yield of a corporate bond index. When the differential is large, bonds appear rich and when it is small bonds look cheap. There are structural differences in dividend policy between Australian and US companies, with the latter paying out less as dividends as more as buybacks, this transforms the data somewhat, with the investment grade corporate bond yield normally carrying more than the equity dividend. Nonetheless, the historic comparison across the cycle is informative.
AUD Equity Dividend Yield minus IG Corporate Bond Yields
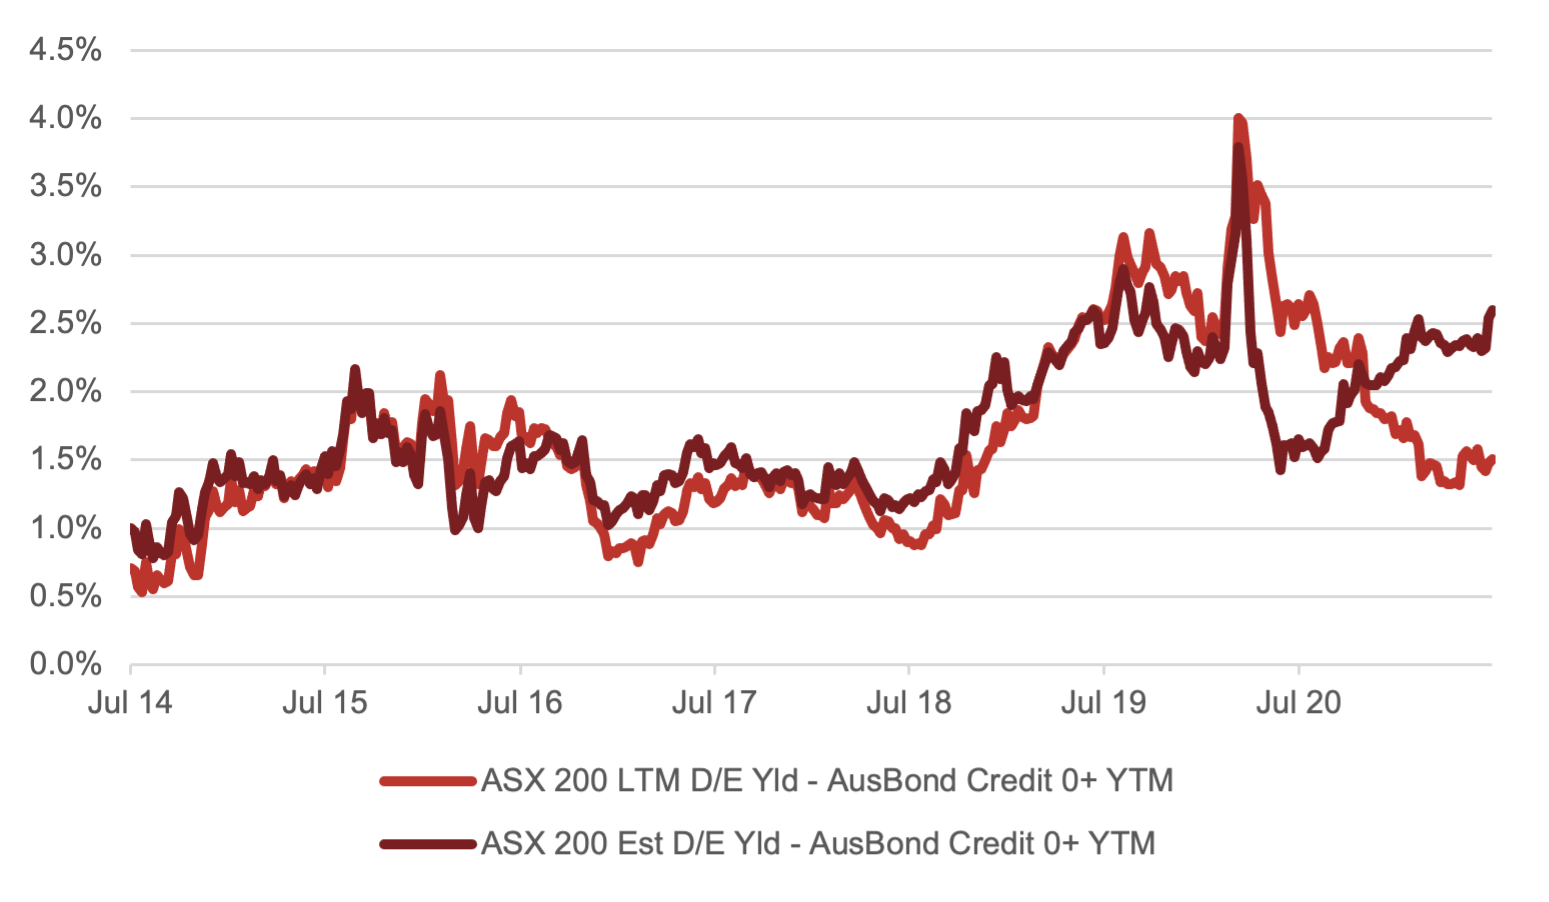
(Figure 7 – Source: BondAdviser, Bloomberg. As at 7 March 2021.)
Whilst on a last twelve-month basis dividend yields make domestic bonds look somewhat cheap, we prefer the estimated future dividend yield given the COVID impact, where many companies cut, or scrapped dividends is looked-through. On this basis, domestic investment grade bonds look expensive – and an extraordinarily large amount of supply has been digested without a hiccup – it really is an issuers market in Australia presently, we prefer to be nominally underweight for this reason.
AUD Supply – Corporates
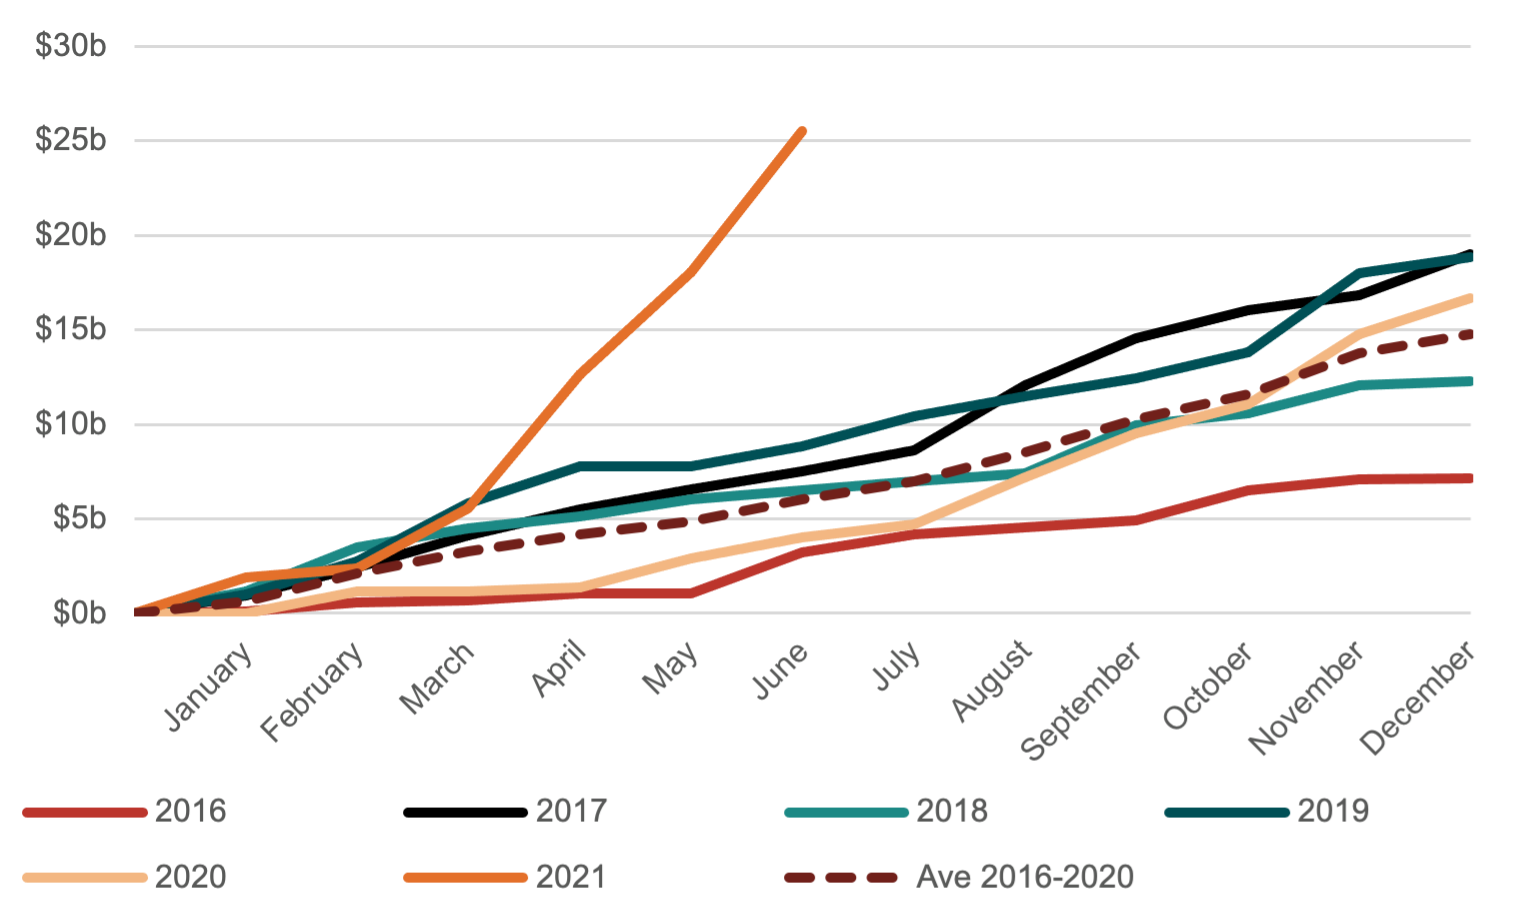
(Figure 8 – Source: BondAdviser, Bloomberg. As at 30 June 2021. Capturing ISINs beginning in AU only. Corporates defined as all issuers excluding Government Entities, Banks, and Insurers. )
The narrative is contrasting in the US, however, given the emphasis placed on capital return. Particularly since changes in the tax law, the analysis is opaquer. Bonds are flagging as marginally cheap from an opportunity cost perspective.
USD Equity Dividend Yield minus IG Corporate Bond Yields
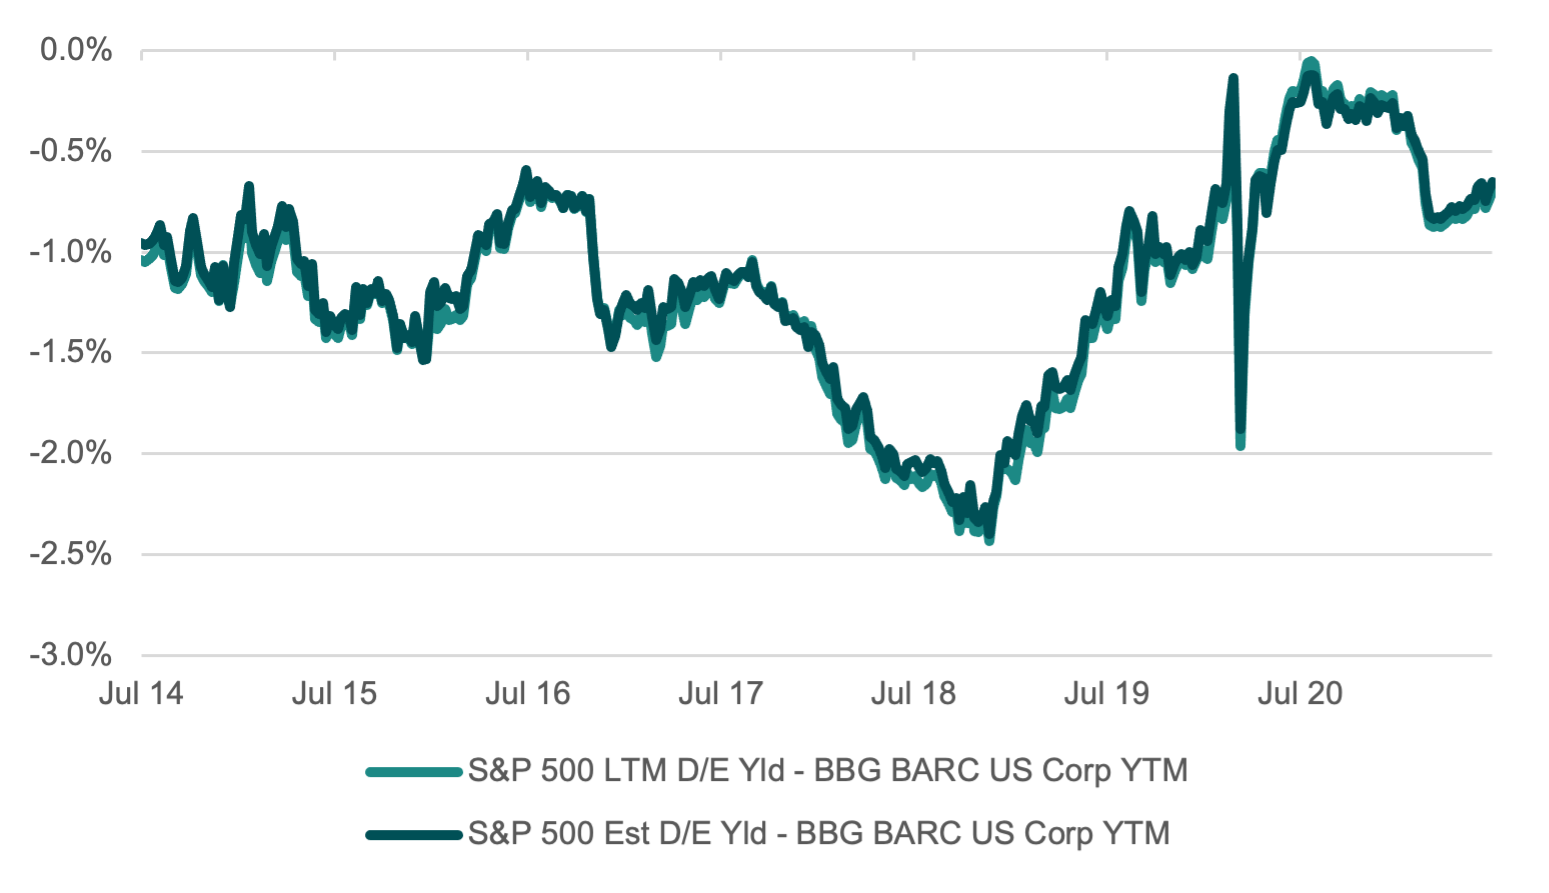
(Figure 9 – Source: BondAdviser, Bloomberg. As at 7 July 2021.)
It is hard to stomach IG bonds signally cheap. Spreads are at or near the lowest ever. However, we argue that this is reasonable for two reasons (1) the Fed in backstopping the investment grade market, whilst now having withdrawn, have signaled it will provide support in distress – this reduces the need for any liquidity premium, given there is a buyer of last resort in the Fed. (2) Spreads should be low given the low average default rates compared to prior history as illustrated in Figure [x]. There is merit to suggest that spreads should tighten further, which is why maintain a neutral stance in the US IG market.
Default Rate Avg vs Spread Avg
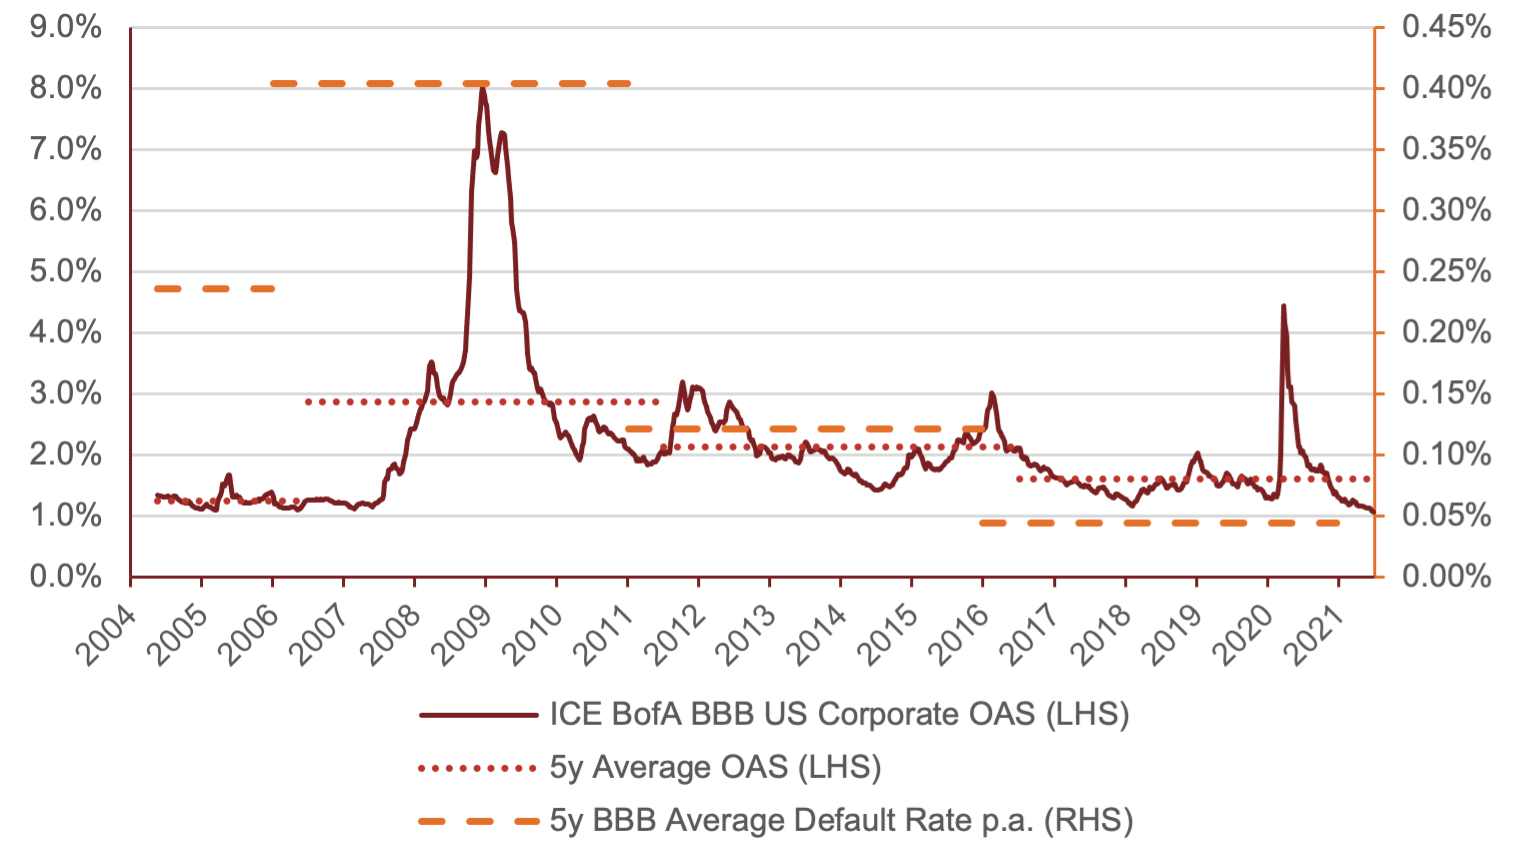
(Figure 10 – Source: BondAdviser, Bloomberg. As at 7 July 2021.)
High Yield Corporates
Finding the high in high yield is a difficult task these days in the US market. In fact, the yield of the index has fallen below inflation. This is a function of an increase in inflation but also the impact of a frantic reach for yield environment. Additionally, it is true to say that the composition of the benchmark has better credits and can afford to tighten compared to history. From an interest servicing perspective this is true, however we are wary of zombie company exposure. exposure to zombie companies.
Real Yields on High Yield
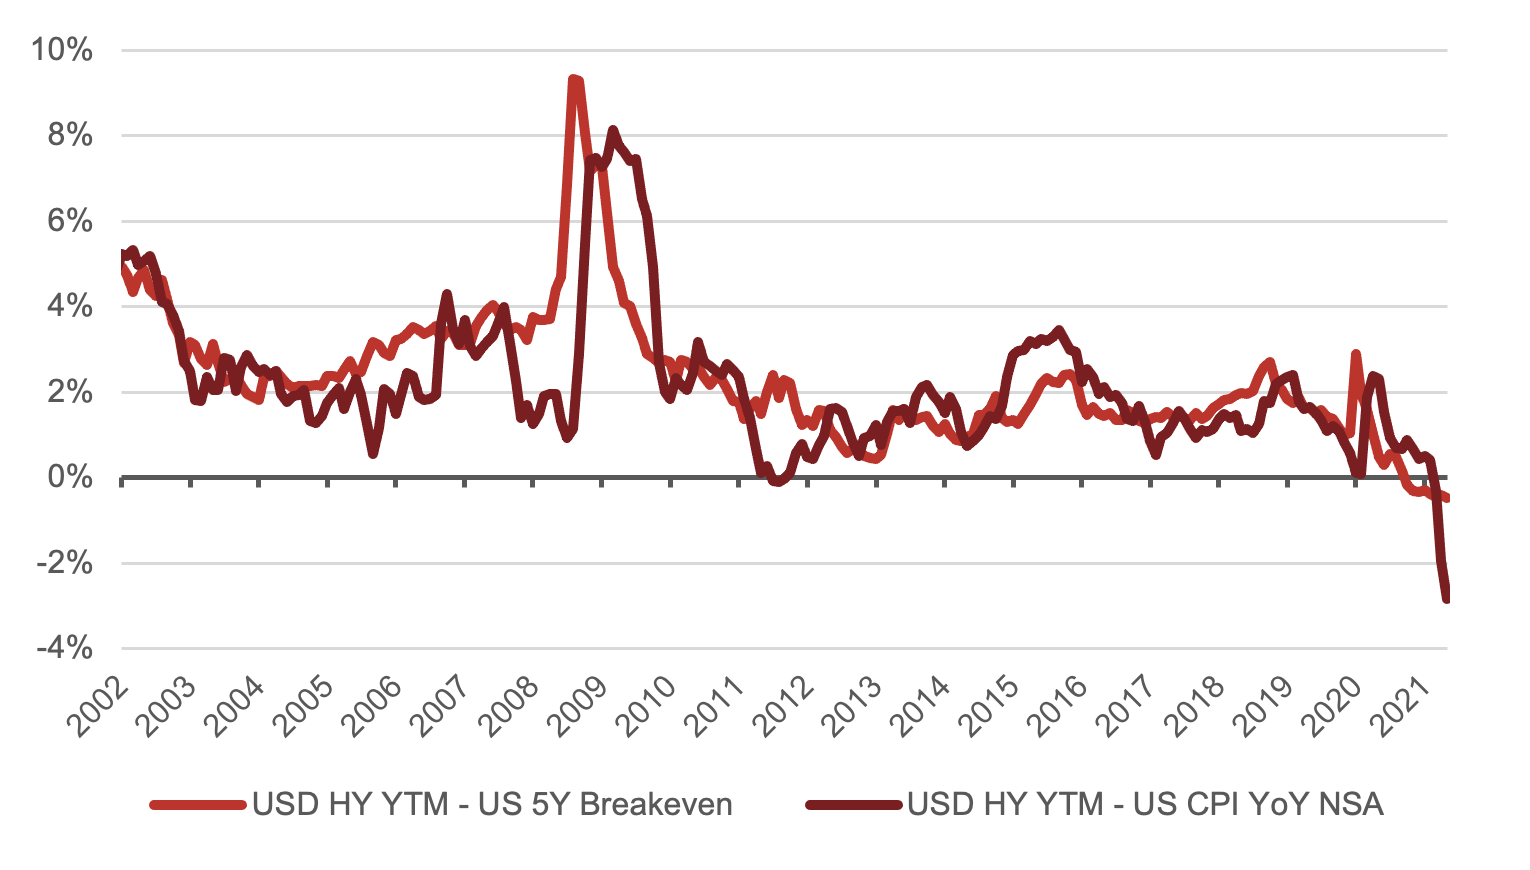
(Figure 11 – Source: BondAdviser, Bloomberg. As at 7 July 2021.)
Whilst we are still finding idiosyncratic opportunities in the USD market, from a beta perspective we are cautious given our position in the cycle. To examine where we are in the cycle, we use our favoured cycle chart, which we first explained here and have subsequently discussed here, here, here and here. More recently the moving average figures have ticked up, placing us firmly within the recovery stage but not with the same velocity as was present post GFC.
US 30Y-3M Spread Relative to 2Y Moving Average (bps)
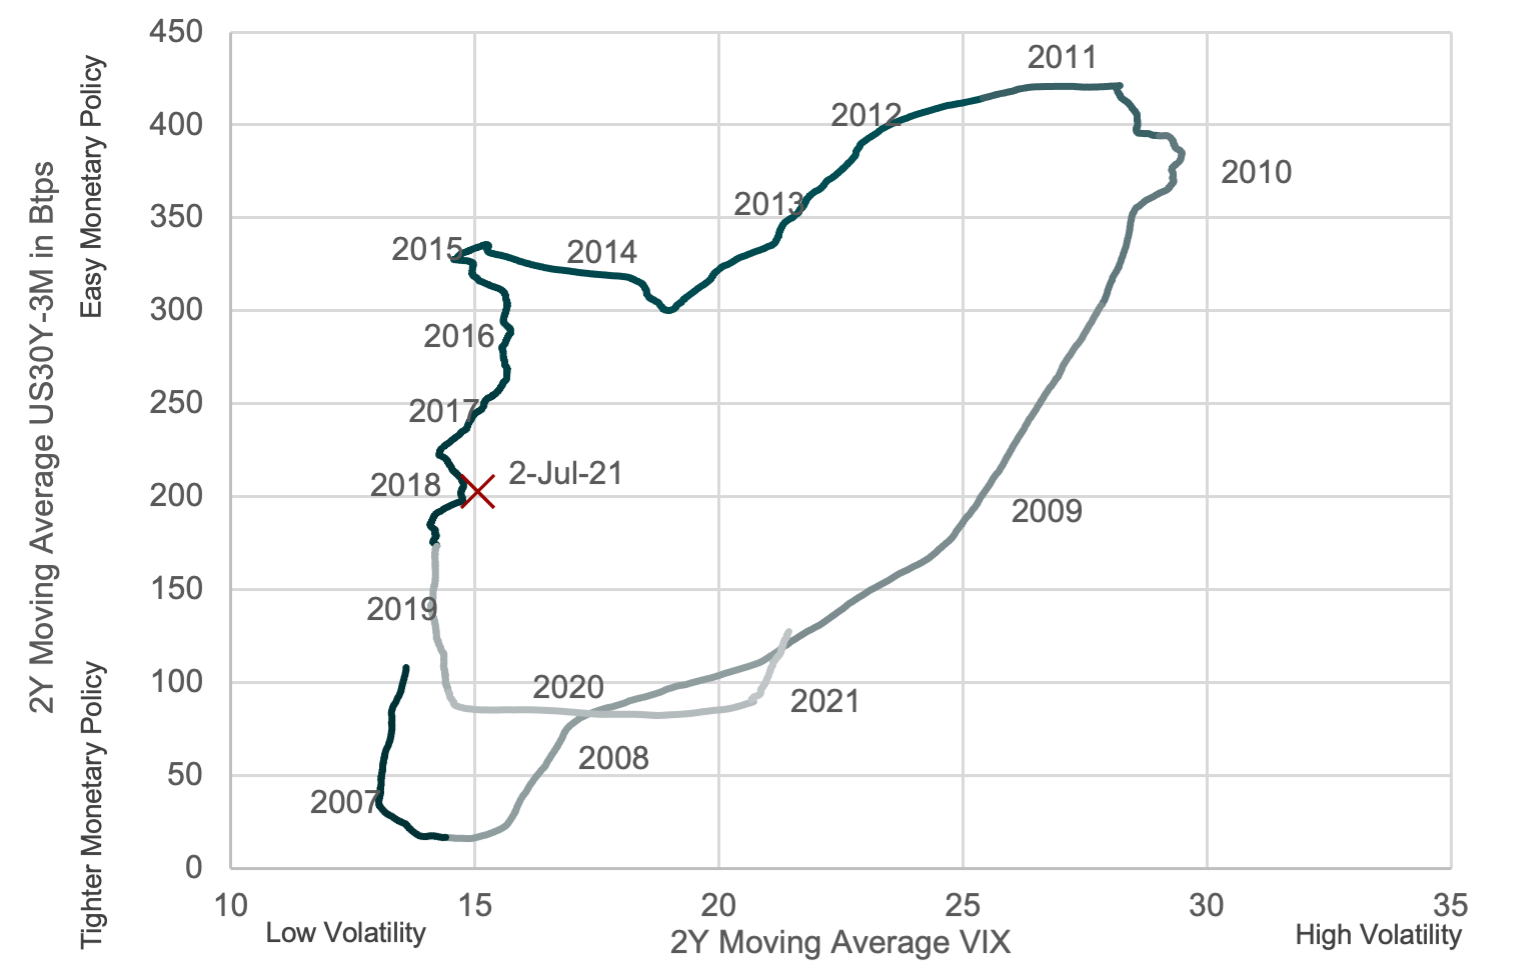
(Figure 12 – Source: BondAdviser, Bloomberg. As at 2 July 2021.)
Interestingly, the most recent data points, void of moving average (indicated by the red cross), suggest we could be on track for a mini cycle. This is something we are watching closely. Given cross-asset class valuations, this is not difficult to justify. We note given the enormous quantum of monetary support; it is possible our relationships have broken down. Figure [x] illustrates this best, where the MOVE Index, a proxy for fear in the bond market, is well below the moving average after only temporarily spiking for a matter of weeks in the height of the COVID sell-off – nationalisation of credit markets down to investment grade status saw ample liquidity return to the market and drove a stake through any prospect of a lasting rise in the MOVE Index, notably dissimilar to the VIX which remained elevated throughout 2020.
If we are in a lasting recovery, whilst spreads may grind tighter, we feel there is limited margin benefit from a beta perspective. Given the prospect of a mini cycle, we are trimming risk where this is a no obvious value case. The output here, in both scenarios, is one in the same, limit USD HY market exposure, unless pursuing alpha in concentrated idiosyncratic opportunities.
MOVE Index Feedback Loop
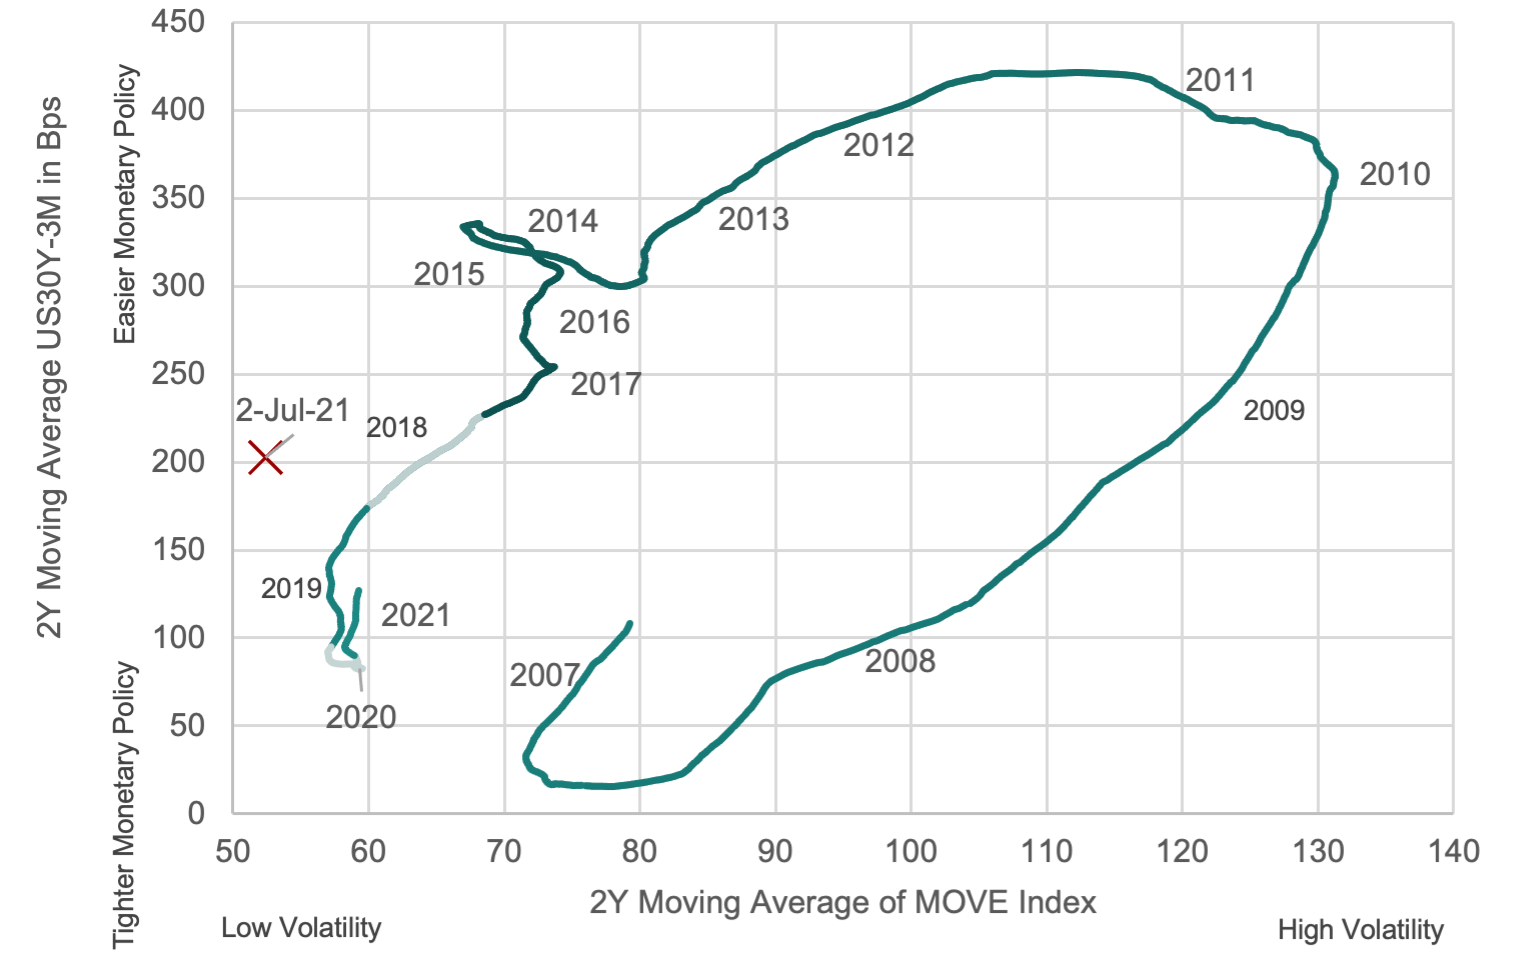
(Figure 13 – Source: BondAdviser, Bloomberg. As at 2 July 2021.)
Domestically, we have a different view, as a far more fragile market has manifested in limited supply and robust new issue concessions to fair value, with covenant protection and security remaining commonplace. Contrasting that of domestic investment grade, in the high yield market, we continue to see an investors market.
We are largely overweight here, seeing attractive value in specific securities, at various parts of the capital structure, issued by a variety of entities including Centuria, Peet, Civmec, Avanti Finance, MoneyMe and Nufarm. In our opinion, the biggest problems present in the Australian high yield market are liquidity and diversification, however for institutions and sophisticated investors we can turn to synthetics to solve for both.
Financials – Regulatory Capital
Hybrids, often overlooked as poor value in relation to equity, have performed exceptionally well in the past 5 years – providing a similar return for far less volatility. Whilst we believe AT1 market performance will moderate given compressed margins, we still view hybrids as providing well-needed capital structure diversity to equity or traditional fixed income investors.
Hybrids vs Equities
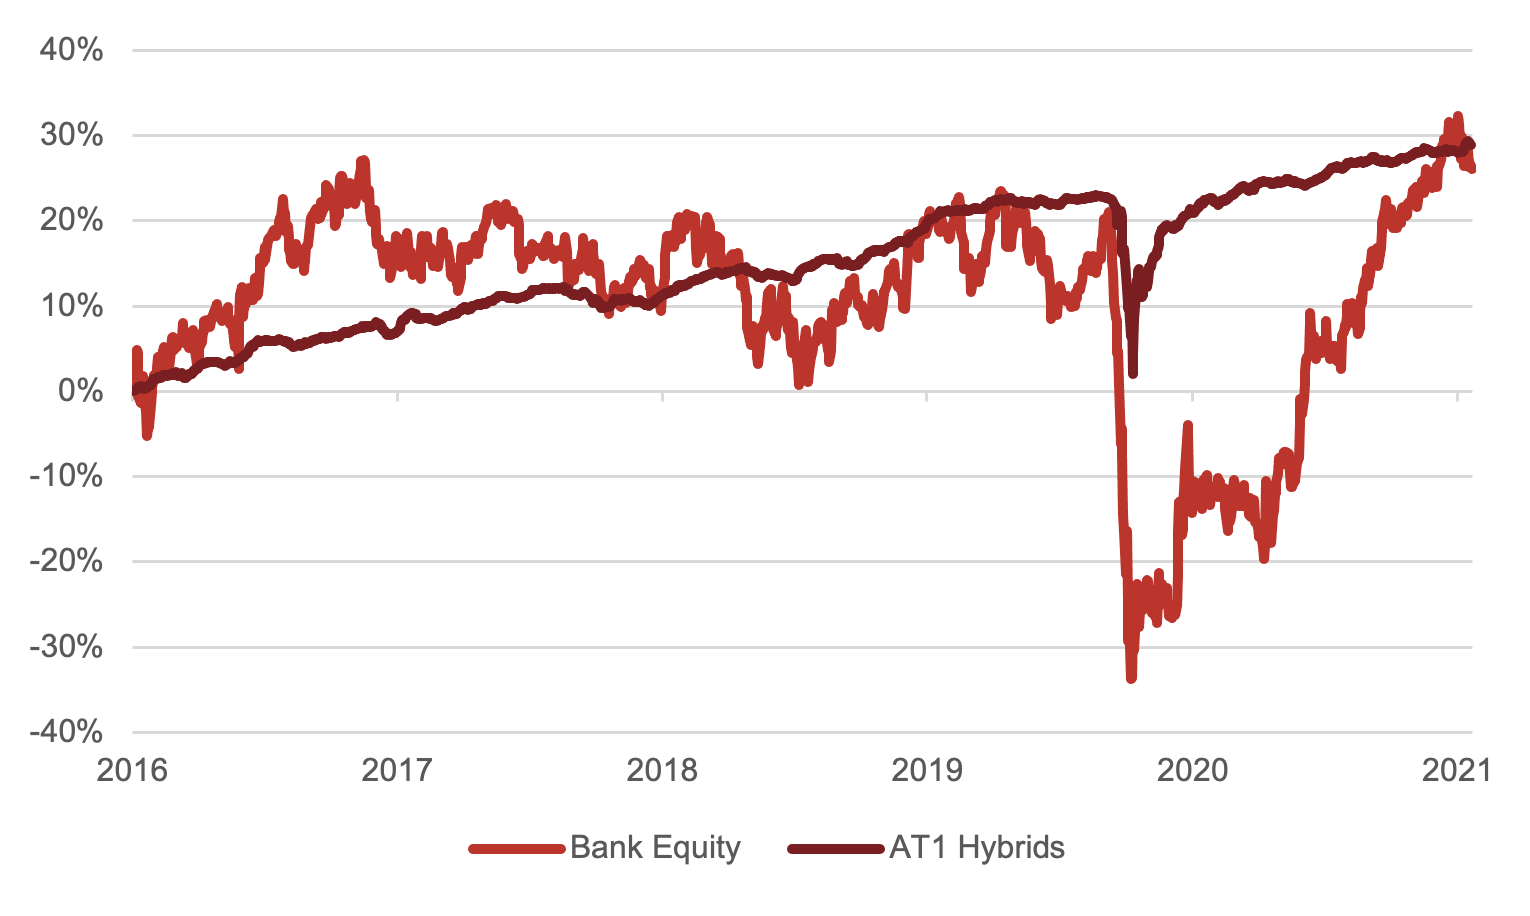
(Figure 14 – Source: BondAdviser Index Platform, Bloomberg. As at 7 July 2021. BAAUAT1DFTR. Bank equity performance proxied using VanEck Australian Banks ETF (ASX: MVB).)
In a post Basel III environment spreads in the AT1 space are tight as ever. We turned overweight on AT1’s in April, noting several tailwinds that would push margins lower. This environment remains and we would look for another ~20bps of tightening before beginning to take profits – the first off the table would be the non-majors, the additional risk has been well rewarded, but it is high beta in a sell-off, so we would look to trim prudently while the market is solid.
Even though the value is being squeezed from the market, we are still realising opportunities in relative value trading in hybrids. Here we look to capitalise on mispricing rather than holding for carry and market compression. In less than a month, our relative value trade on ANZPF recently catalysed a 21% IRR.
AT1 Box Plots

(Figure 15 – Source: BondAdviser, Bloomberg. As at 7 July 2021. Data post Basel III from January 2013 onwards.)
AT1 Trading Margins
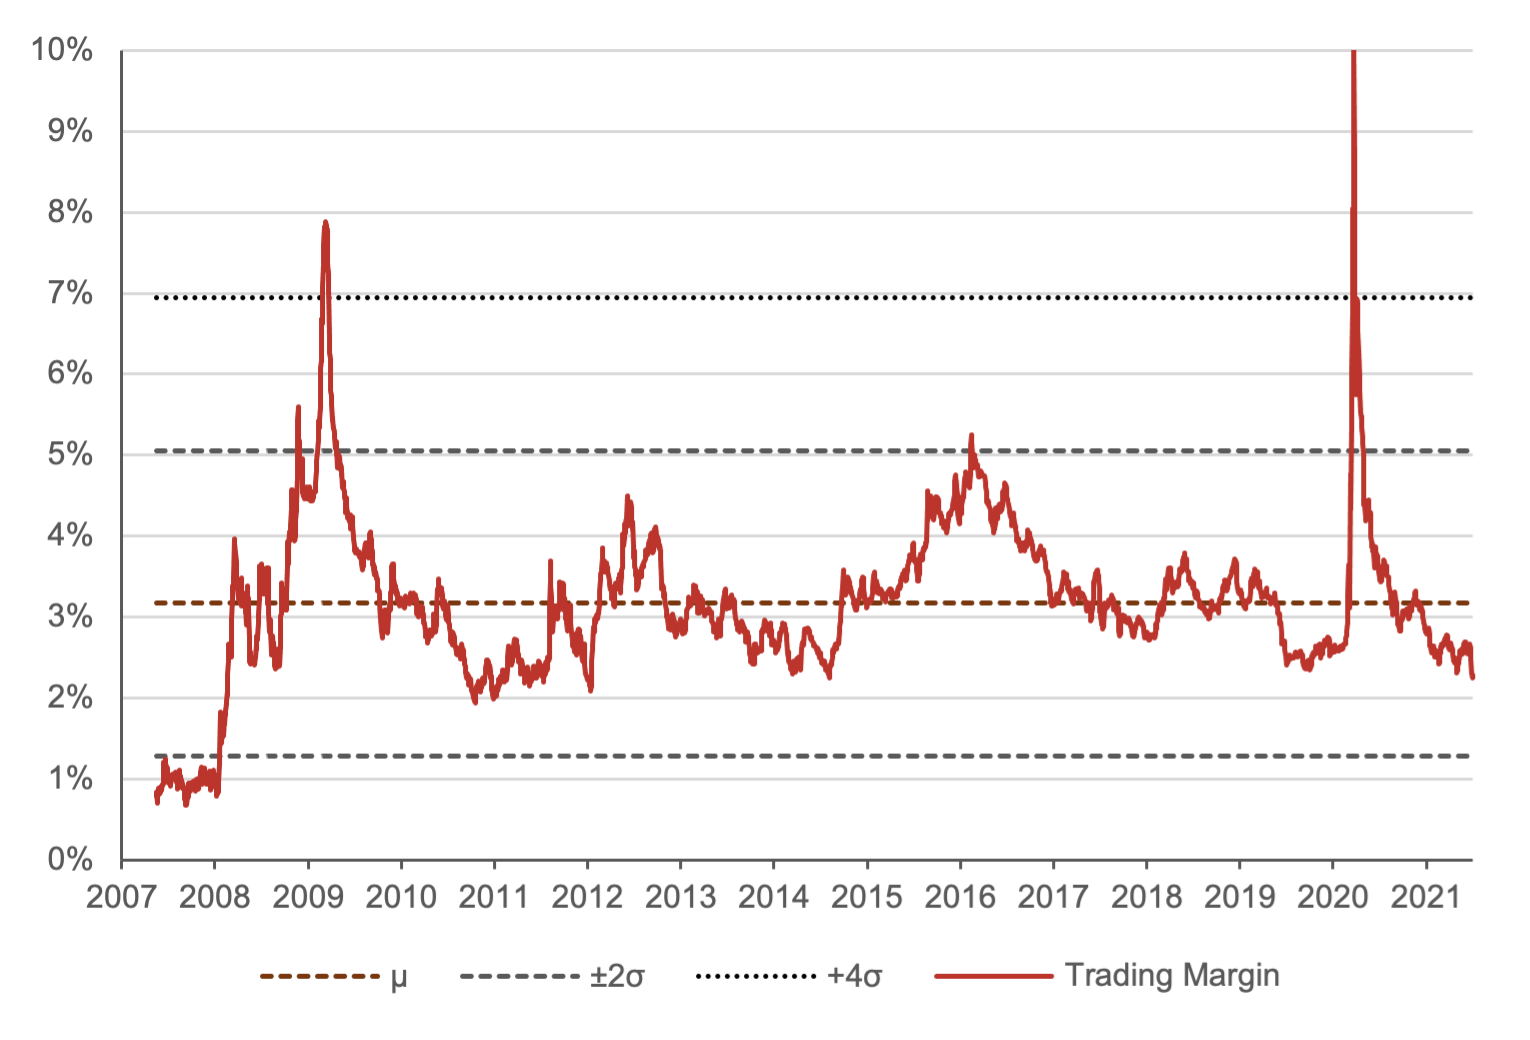
(Figure 16 – Source: BondAdviser Index Platform. As at 7 July 2021. BAAUAT1DFTR.)
We are reducing exposure in Tier 2 credit, being happy to take profits following our overweight positioning initially in June 2020 and subsequently doubling down in October 2020. Whilst happy to take the additional incremental risk at the AT1 level, in-effect reaching for yield, we trim our Tier 2 positioning to an at best neutral stance. This reduces some counterparty exposure at the pointy end of the capital structure but also capitalises on strong performance.
Our expectations on supply pressures regarding TLAC exposure have moderated, but this is offset by trading at tights and the blurred lines problem we first recognised in July 2019, where APRA stated it “does not consider there would likely be any difference between the point of non-viability and resolution”. We consciously opt to squeeze tights in AT1 instead of Tier 2 but note for those restricted against hybrids, we still see (1) new lows being made and (2) relative value opportunities.
T2 Rank and Percentile
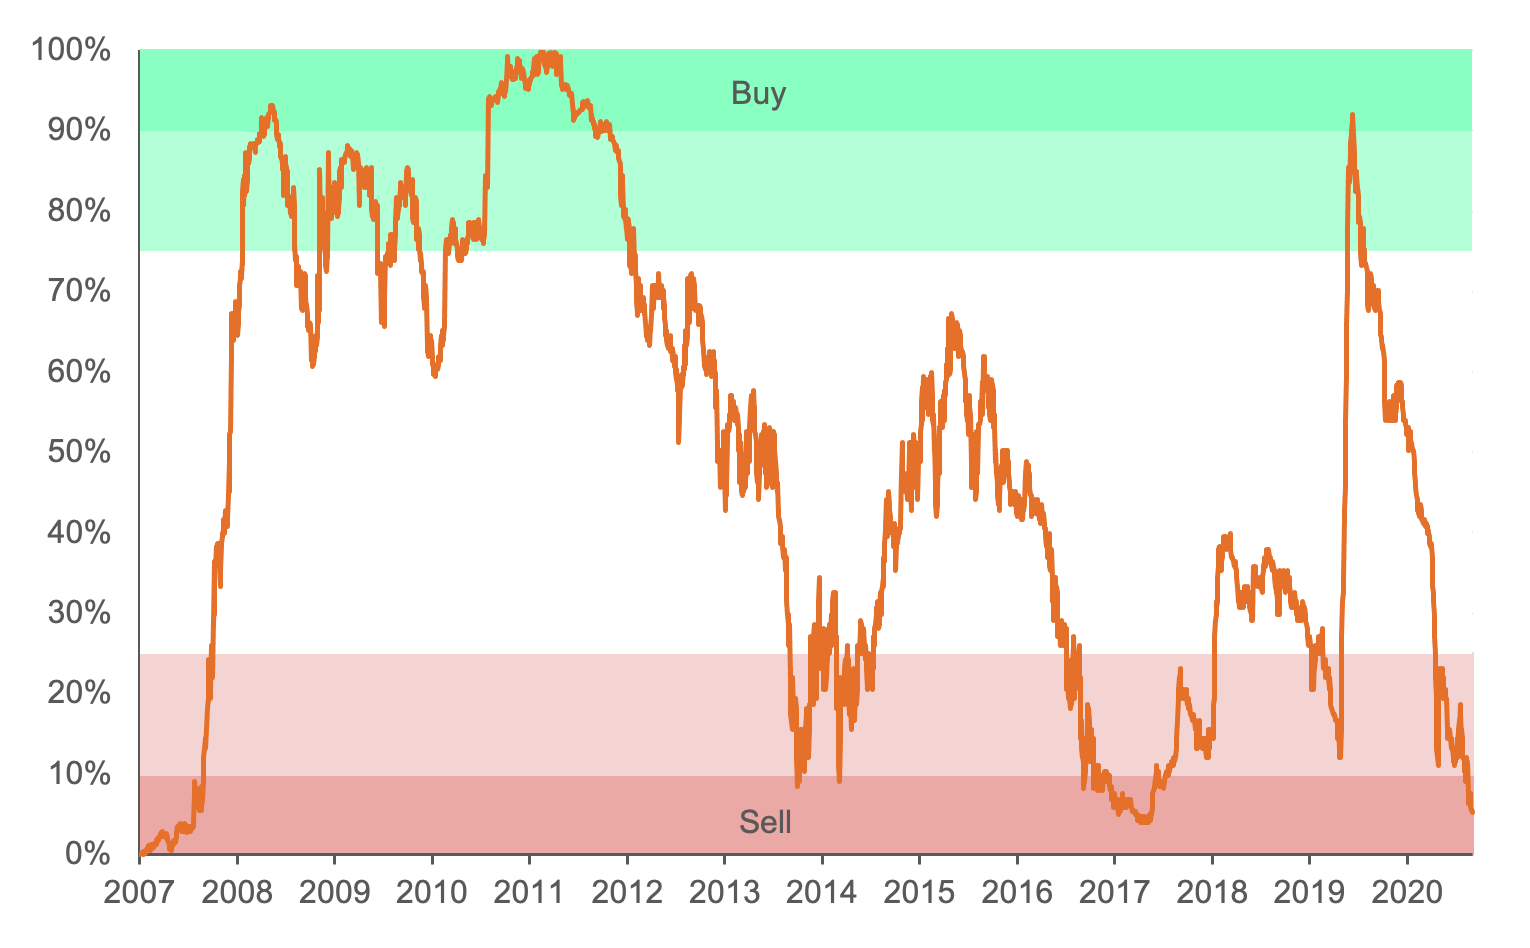
(Figure 17 – Source: BondAdviser Index Platform. As at 7 July 2021. BAAUT20DNTR.)
T2 Trading Margins
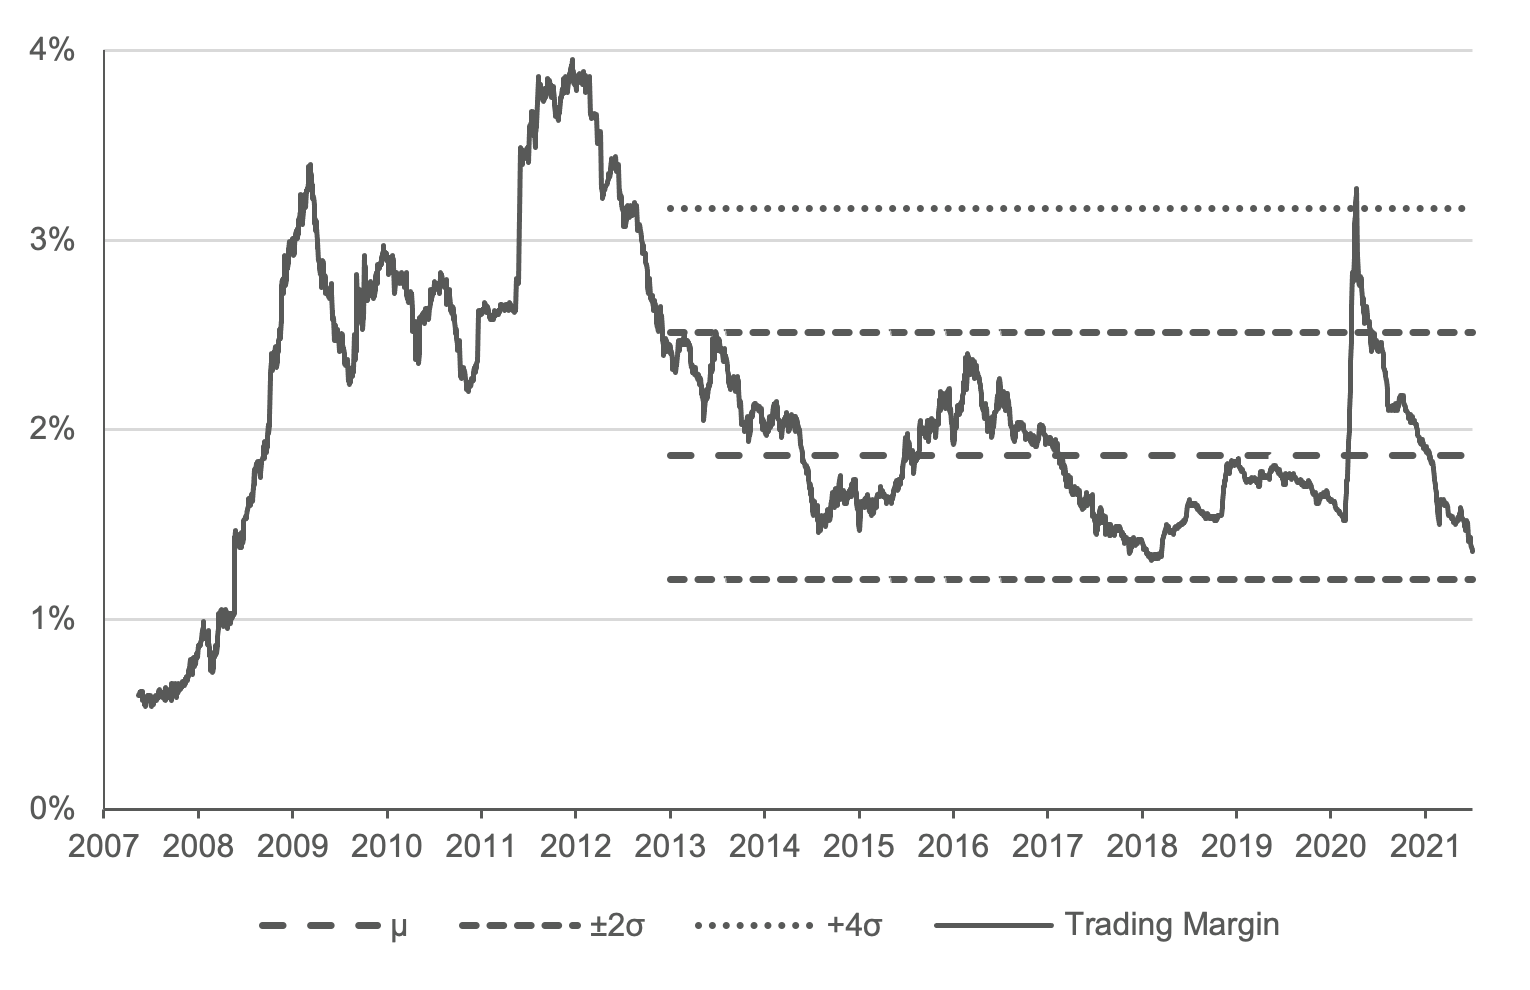
(Figure 18 – Source: BondAdviser Index Platform. As at 7 July 2021. BAAUT20DNTR.)
Financials – Senior
On secondary trading we remain underweight in senior unsecured paper. Whilst we prefer the typically floating rate structure, with the TFF having resulted in a vast supply of paper maturing without refinancing, an excess of investor capital has crowded-in spreads. Now with the TFF closed, banks will need to return to capital markets. Margins will improve on primary compared to secondary due to the term, which is not unexpected. It may induce some term rolling, which will place pressure at the front end. We see +$160 billion of potential issuance and are avoiding outstanding bonds on this basis.
Senior Unsecured Trading Margins
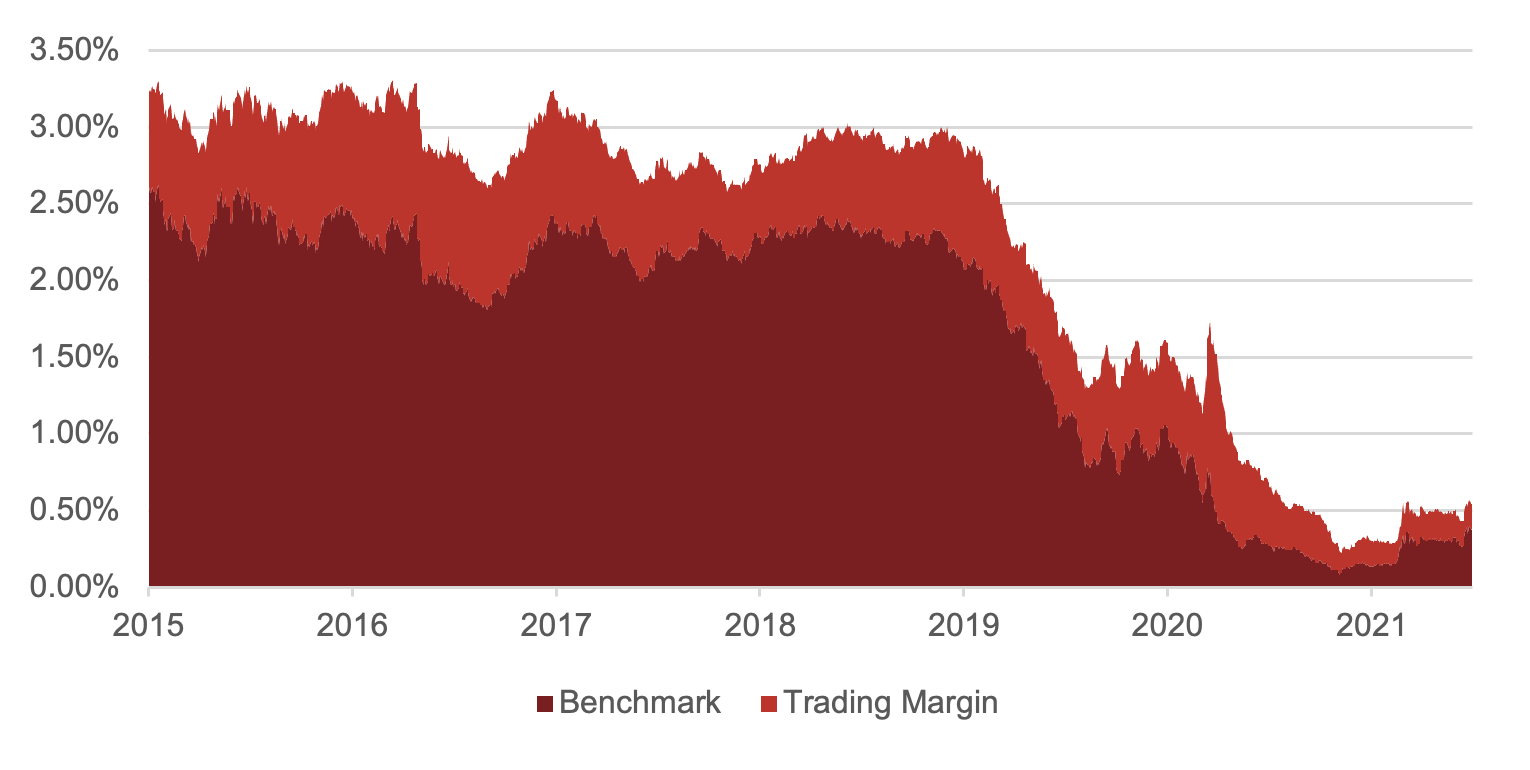
(Figure 19 – Source: BondAdviser Index Platform. As at 7 July 2021. BAB4SU0DNTR.)
Senior Unsecured Rank and Percentile
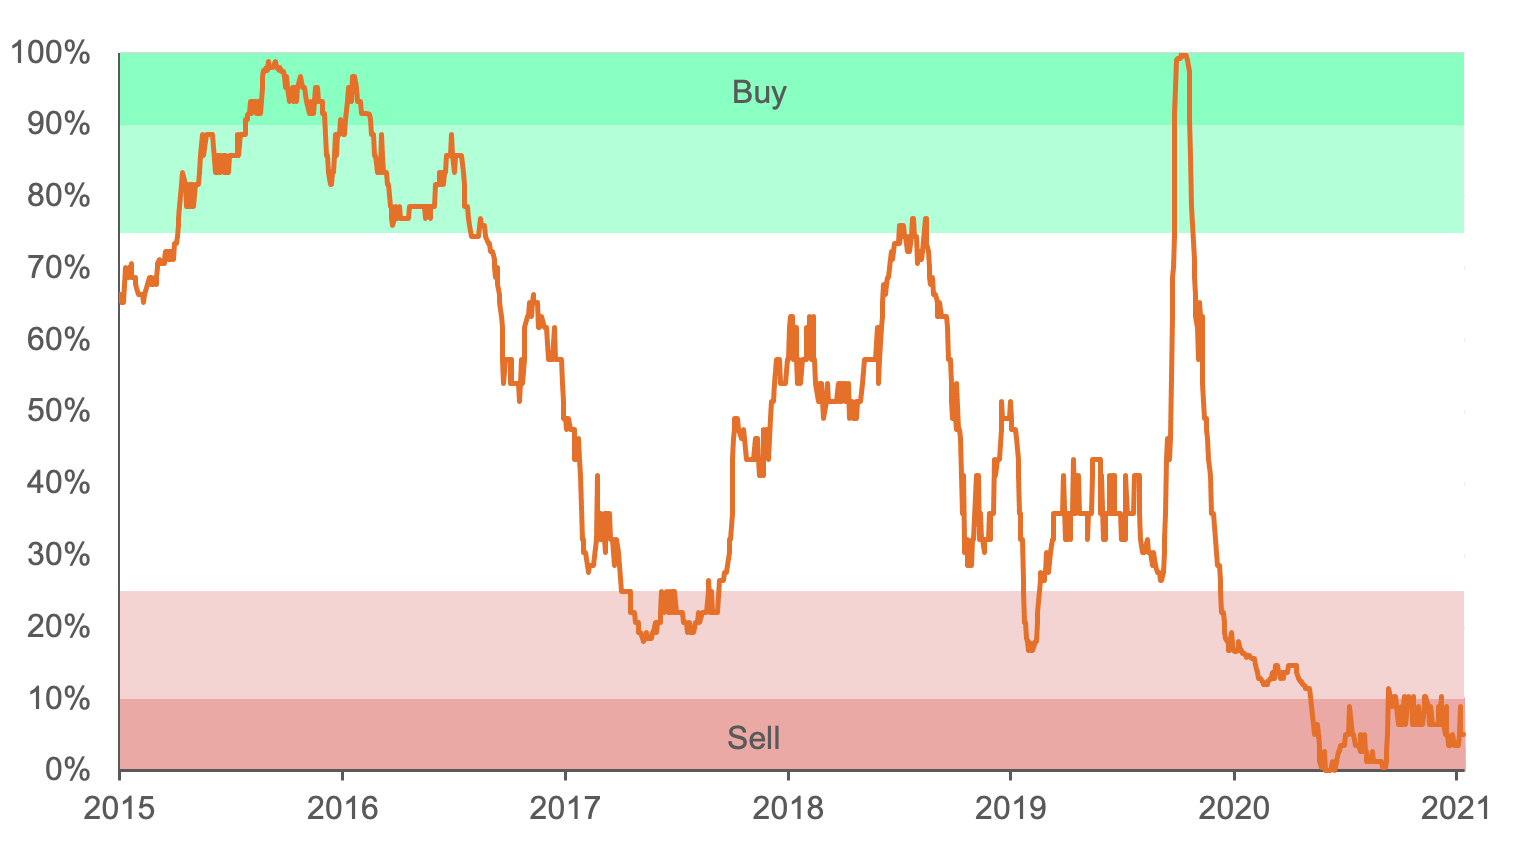
(Figure 20 – Source: BondAdviser Index Platform. As at 7 July 2021. BAB4SU0DNTR.)
Private Debt / Loans
Net Yields – Domestic Private Debt Strategies
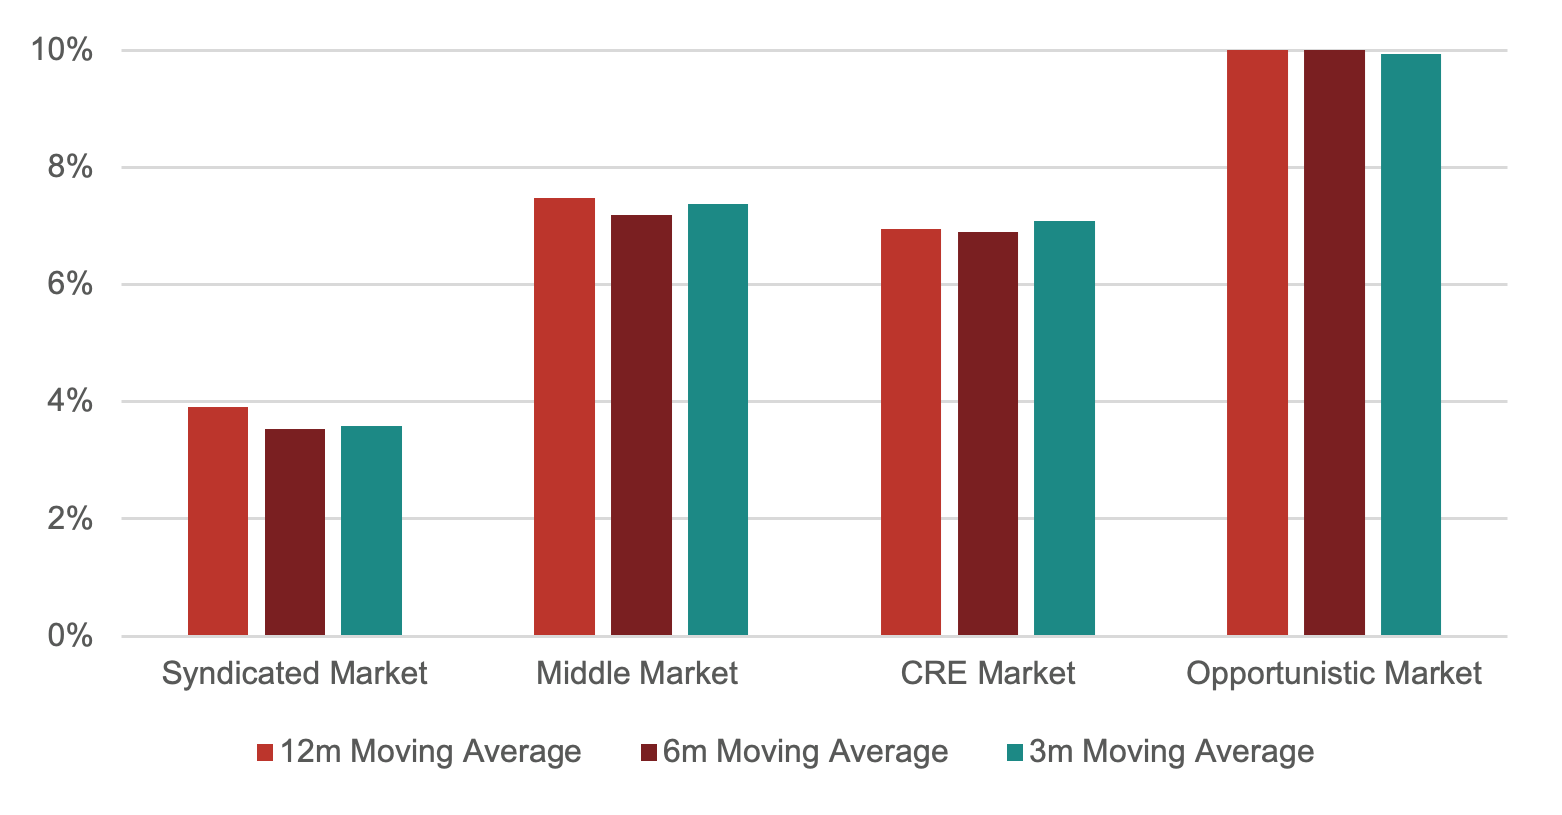
(Figure 21 – Source: BondAdviser. As at 31 May 2021. Syndicated Market is represented by Metrics Credit Partners Diversified Australian Senior Loan Fund. Middle Market is represented by the average of both Metrics Credit Partners Secured Private Debt Funds I and II. Commercial Real Estate (CRE) Market is represented by the average of Qualitas Real Estate Income Fund and Metrics Credit Partners Real Estate Debt Fund. Opportunistic Market is represented by Metrics Credit Partners Credit Trust.)
In a 0.10% RBA cash rate environment, finding real yield has become daunting for investment managers. We continue to advocate that those with discretionary mandates should be overweight private debt. Whilst competition is increasing, the capital vacuum left by the banks remains vast. The carry-on offer, alongside risk-return parameters, warrants allocation to portfolios.
Loans, typically being floating rate in nature, offer duration protection. Additionally, domestic covenant control remains strong compared to the US, especially with respect to the syndicated market.
Private debt encompasses a range of strategies with varying risk-rewards. Presently, we prefer the domestic, middle-market, bilateral space but will look to ensure our portfolio is appropriately diversified to reduce idiosyncratic and concentration risk.
Net Yields – Time Series

(Figure 22 – Source: BondAdviser. As at 31 May 2021. Syndicated Market is represented by Metrics Credit Partners Diversified Australian Senior Loan Fund. Middle Market is represented by the average of both Metrics Credit Partners Secured Private Debt Funds I and II. Commercial Real Estate (CRE) Market is represented by the average of Qualitas Real Estate Income Fund and Metrics Credit Partners Real Estate Debt Fund. Opportunistic Market is represented by Metrics Credit Partners Credit Trust.)
Author/s: Charlie Callan, Ben Haseler, George Osti
Responsible Manager: John Likos
General Disclosures
BondAdviser has acted on information provided to it and our research is subject to change based on legal offering documents. This research is for informational purposes only.
This information discusses general market activity, industry or sector trends, or other broad-based economic, market or political conditions and should not be construed as research or investment advice.
The content of this report is not intended to provide financial product advice and must not be relied upon as such. The Content and the Reports are not and shall not be construed as financial product advice. The statements and/or recommendations on this web application, the Content and/or the Reports are our opinions only. We do not express any opinion on the future or expected value of any Security and do not explicitly or implicitly recommend or suggest an investment strategy of any kind.
The content and reports provided have been prepared based on available data to which we have access. Neither the accuracy of that data nor the methodology used to produce the report can be guaranteed or warranted. Some of the research used to create the content is based on past performance. Past performance is not an indicator of future performance. We have taken all reasonable steps to ensure that any opinion or recommendation is based on reasonable grounds. The data generated by the research is based on methodology that has limitations; and some of the information in the reports is based on information from third parties.
We do not guarantee the currency of the report. If you would like to assess the currency, you should compare the reports with more recent characteristics and performance of the assets mentioned within it. You acknowledge that investment can give rise to substantial risk and a product mentioned in the reports may not be suitable to you.
You should obtain independent advice specific to your circumstances, make your own enquiries and satisfy yourself before you make any investment decisions or use the report for any purpose. This report provides general information only. There has been no regard whatsoever to your own personal or business needs, your individual circumstances, your own financial position or investment objectives in preparing the information.
We do not accept responsibility for any loss or damage, however caused (including through negligence), which you may directly or indirectly suffer in connection with your use of this report, nor do we accept any responsibility for any such loss arising out of your use of, or reliance on, information contained on or accessed through this report.
© 2021 Bond Adviser Pty Ltd. All rights reserved.
