Fixed Income Research
Investment Strategy
Ark of the Covenant
Jock! Start the Engine!
The longer the rout in global bond markets continues, the more difficult it will become for central banks to control. We continue to believe the US and domestic economy will firmly rebound and that the tide has turned for duration.
The current predicament for central banks reminds us of the opening scene of the iconic Raiders of the Lost Ark. Much has happened recently in global bond markets, so let us discuss this first before returning to the Golden Idol (akin to low unemployment and low inflation).
Rumble in the Jungle – 3 Year Yields vs RBA Target
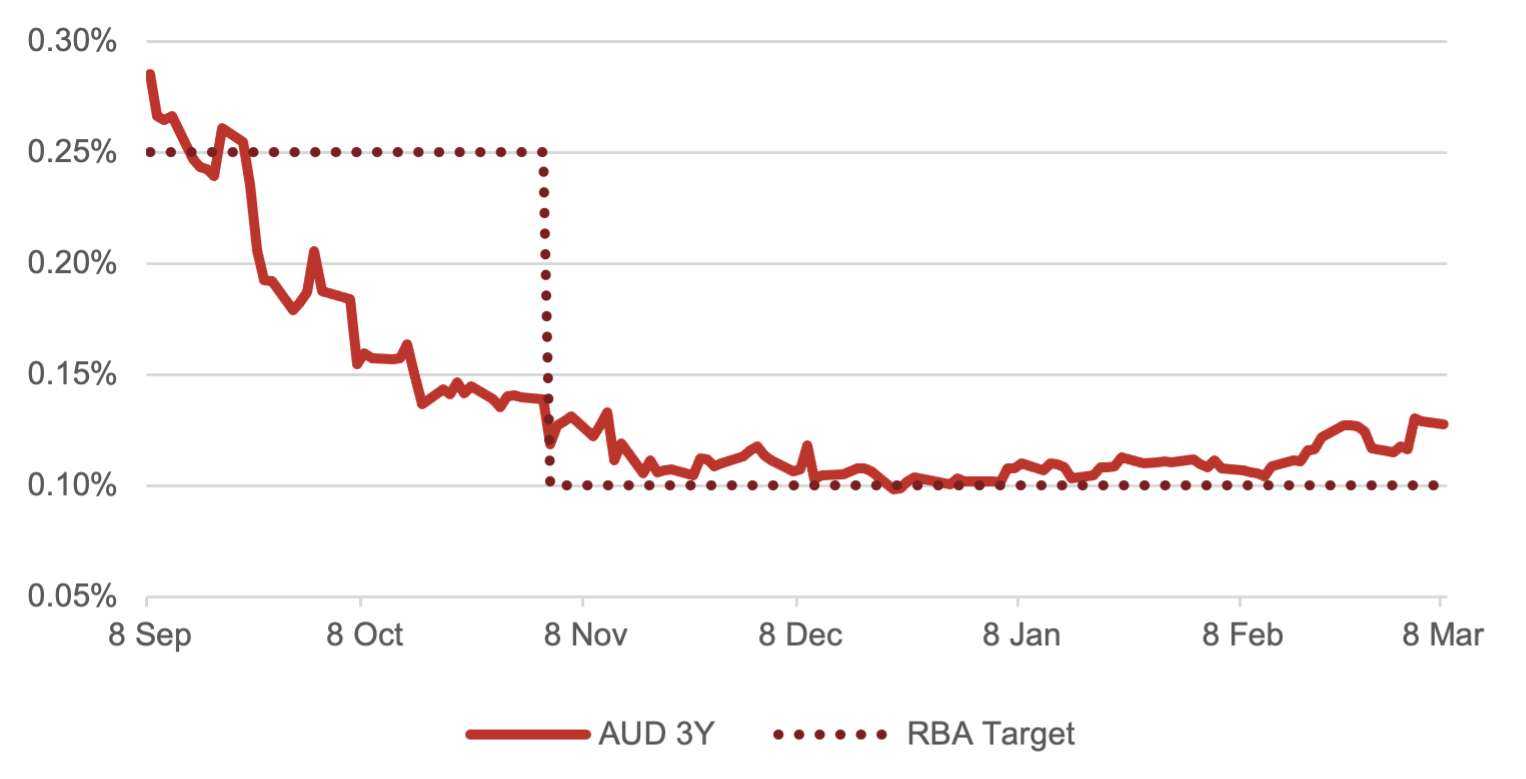 (Figure 1 – Source: BondAdviser, RBA, Bloomberg. As at 7 March 2021.)
Strong economic data sparking fears of inflation has resulted in a volatile government bond market recently. Adding kerosine to this tinder was the rush to exit long positions. Excessive duration present in the market made increases in yield particularly pronounced relative to prices. These were not small shifts. Even in the face of the RBA doubling the size of daily bond purchases from $2 billion to $4 billion, this was not enough to maintain the 3-year target level of 0.10%, which at one stage touched 0.17% intraday.
Domestically, cash rate markets have awoken from their slumber – albeit remaining somewhat subdued. Futures for the interbank overnight cash rate have begun sneaking upwards, indicative of markets calling the bluff on the RBA’s statement of not raising the cash rate before 2024.
In the US, Treasury volatility, as indicated by the MOVE Index, has ticked upwards. While not a dramatic move historically, this reflects normalisation to the five-year average. Even after all the press furore, Treasury volatility is lower than it was for most of 2016.
Reboot in the Cash Market – AUD Implied Future Cash Rates
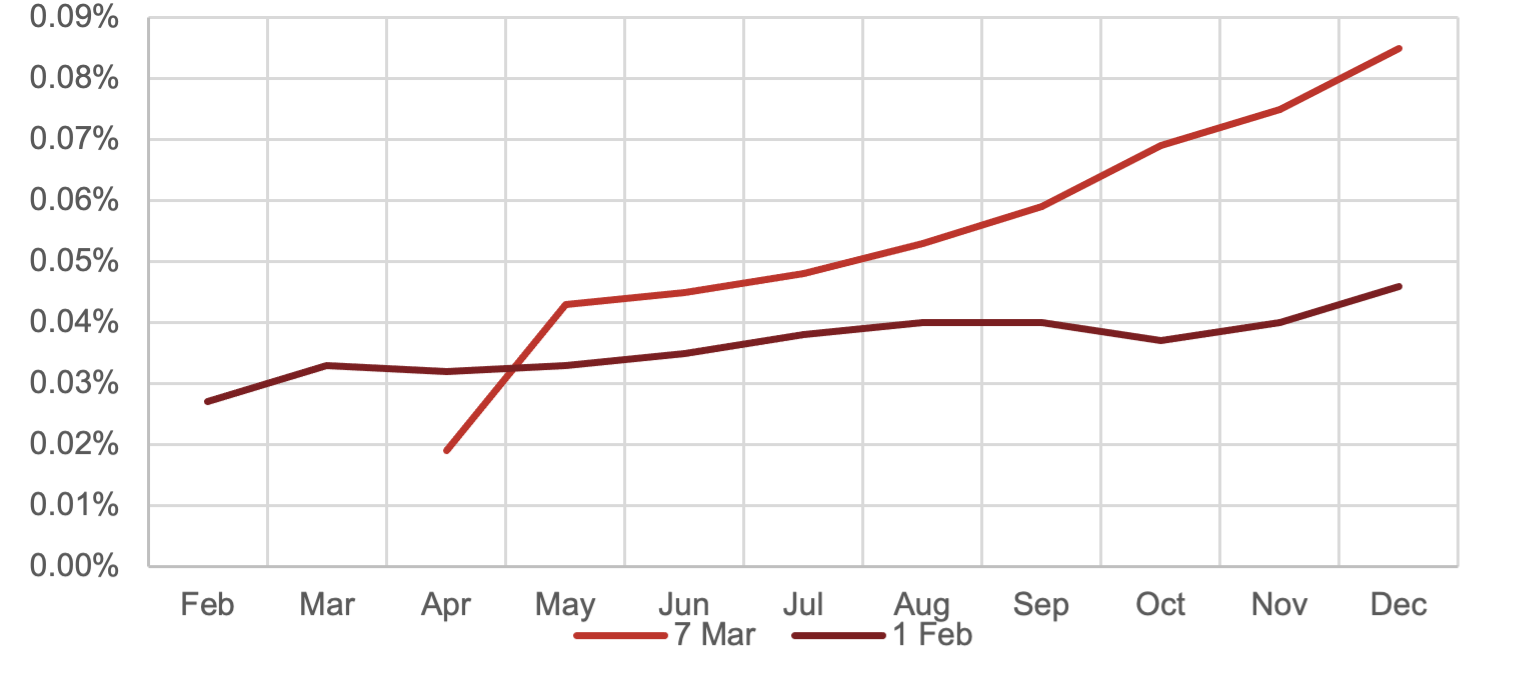 (Figure 2 – Source: BondAdviser, Bloomberg. As at 7 March 2021)
We think the market continues to underestimate the risk of rising yields near term. Furthermore, we believe there will come a point where central bank jawboning will become insufficient to maintain the levels of calm we have become accustomed to.
Is That All? MOVE Index
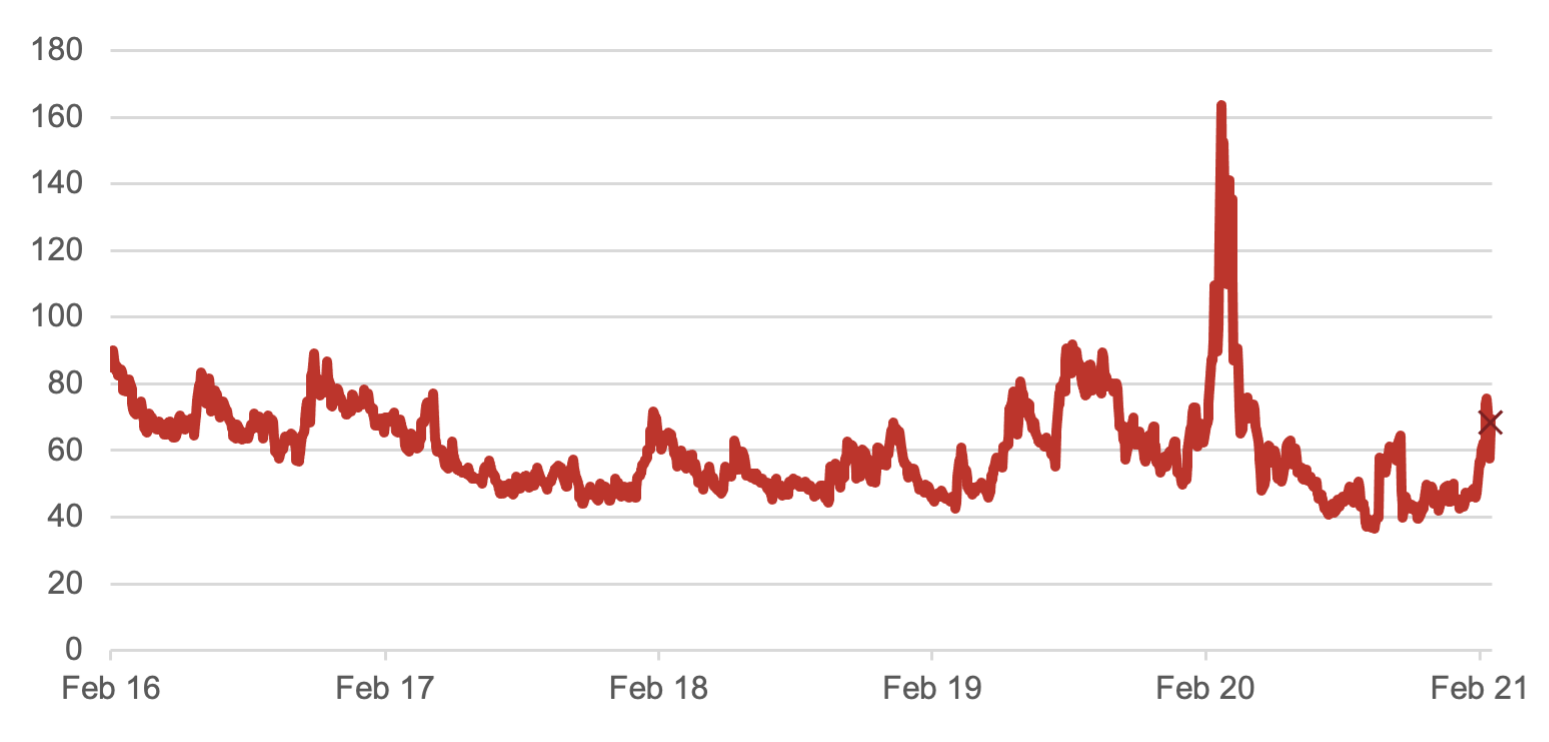 (Figure 3 – Source: BondAdviser, Bloomberg. As at 7 March 2021.)
Domestically, the percentage impact was dramatic. In the last 10 years, the yield increase on 26 February 2021, in generic 5-year BBB banded, non-financial corporates, was second only to 13 March 2020. Much of this is can be attributed to ‘low-base’ maths. However, it highlights the sensitivity of fixed rate corporate bonds, due to the composition of the benchmark – in conjunction with near record low spreads across most sectors.
That Escalated Quickly – AUD BBB Yield Change 1 Day Percent
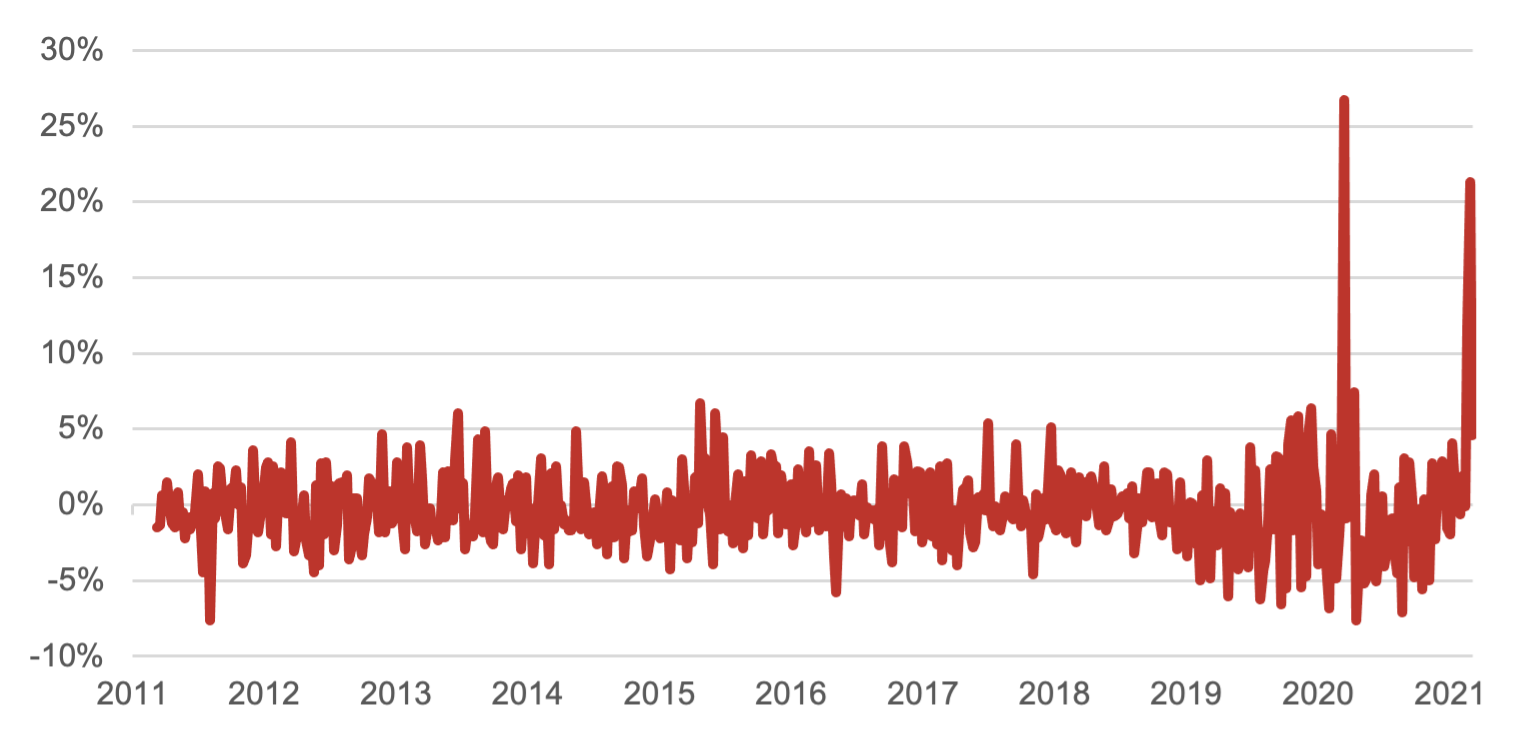
(Figure 4 – Source: BondAdviser, Bloomberg. As at 7 March 2021.)
Bond versus equity yields are compressing. Domestically they are the narrowest in five years. This has been a combination of increasing prices in equities, a fall in cash dividends and an increase in treasury yields. Given lower levels of risk, especially when held to maturity, it could be argued bonds now offer a more compelling allocation proposition relative to equities. Undoubtably, large multi-asset allocators, with long time horizons (endowments, super and pension funds), will be paying attention to this dynamic. This will be a tailwind for a compression in yields and perhaps a structural pressure on equity prices.
Mexican Standoff – Dividend vs Bond Yields
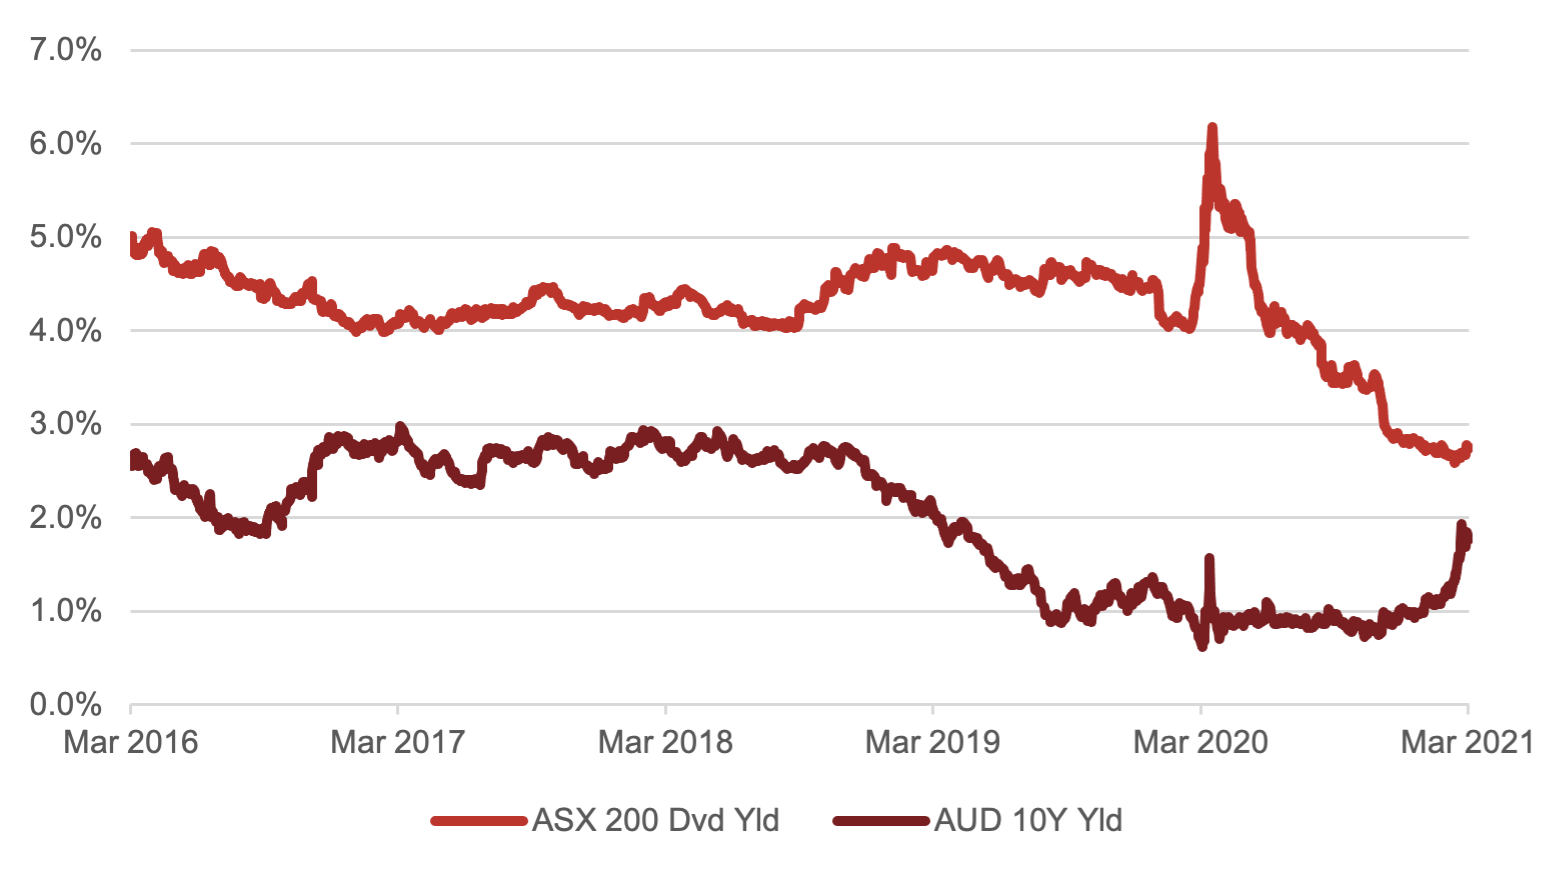
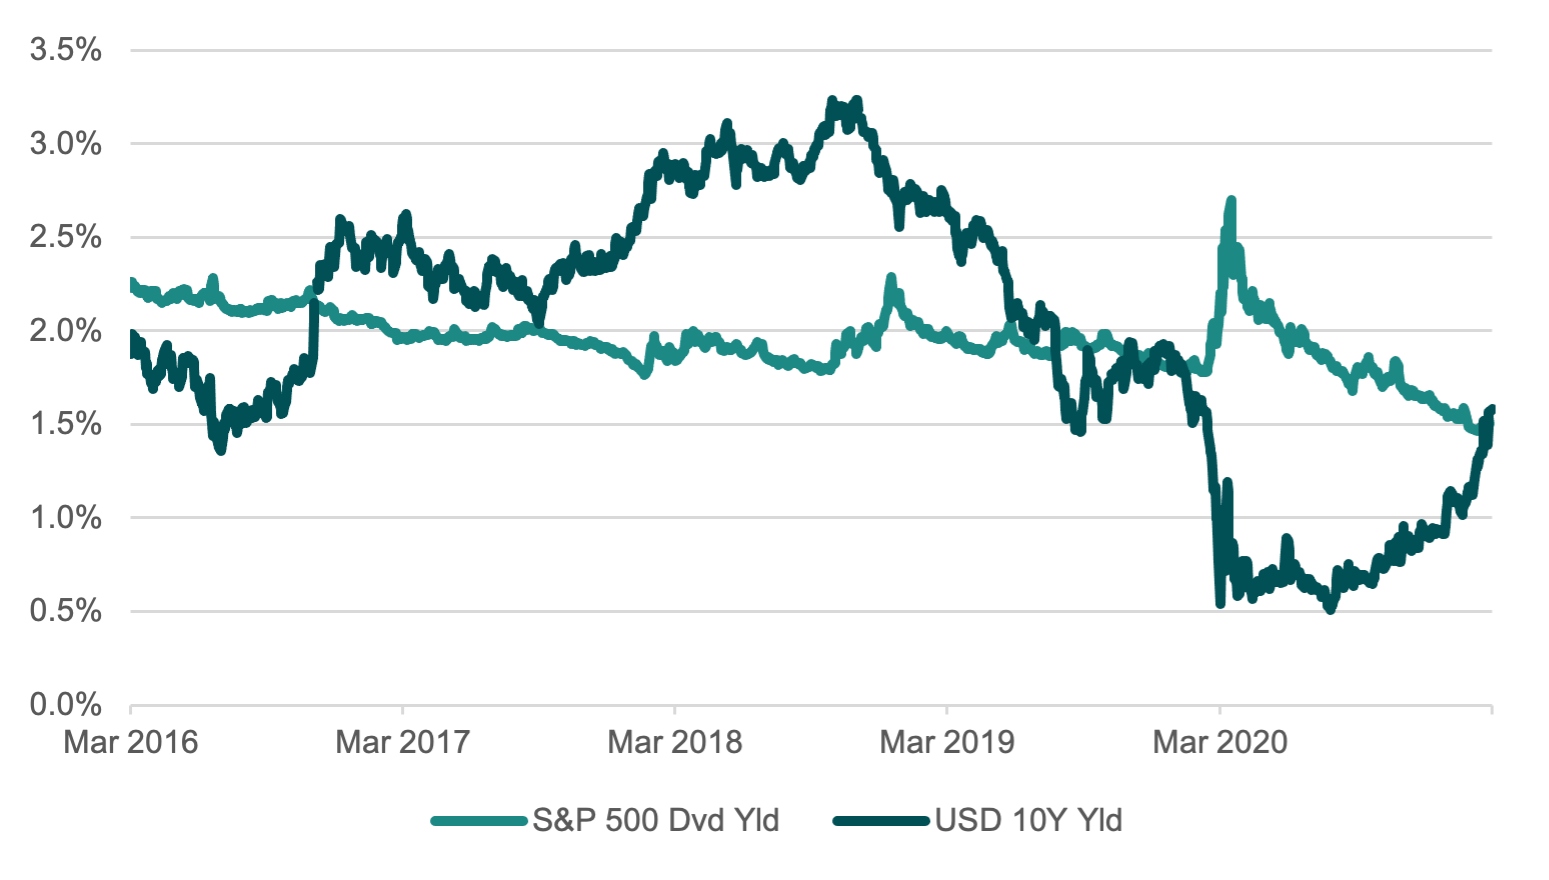 (Figure 5 – Source: BondAdviser, Bloomberg. As at 7 March 2021. LTM Dvd Yield. )
We warned in December about the possibility of an inflation rebound that would burn investors at the long-end. Indeed, the Aussie 30-year bond has fallen 19.5% in price since it last traded at par in October. This is an enormous haircut and highlights our fears of convexity moving against long-tenored, high duration exposures. Unfortunately, should rates continue to increase, this downward price trajectory will continue.
Looking further into the performance of long-dated Commonwealth govies, the recent sell-off has reverted total returns to the more recent trend of 2011-2021. However, this period has been characterised by a consistent compression of yields. Looking back to the performance of 2000-2008 suggests two things: (1) there may be further pain to go; and (2) future rates of total return growth may slow – being more reflective of traditional carry returns rather than duration driven capital gains.
The Door Hitting You – AUD 30 Year Price
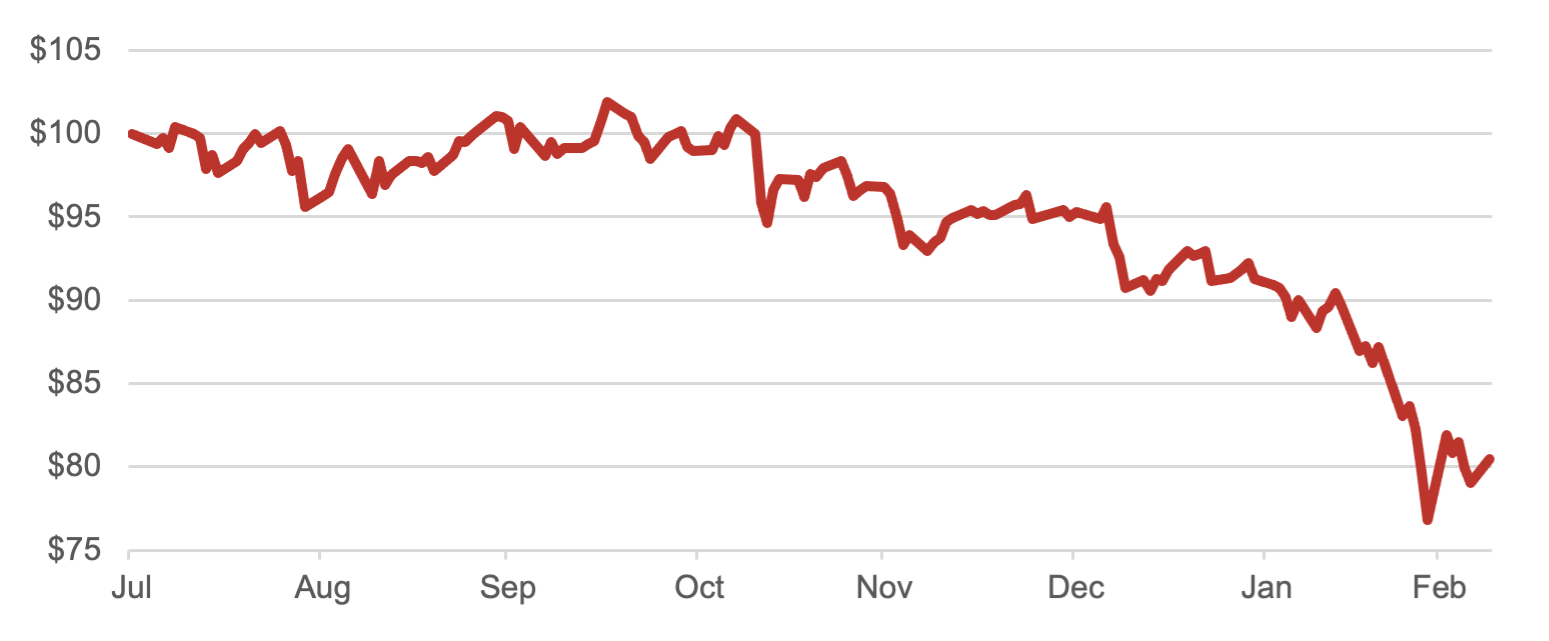
(Figure 6 – Source: BondAdviser, Bloomberg. As at 7 March 2021.)
We Will Fall Further? AUD Treasuries 10+ Yr Index (Total Returns)
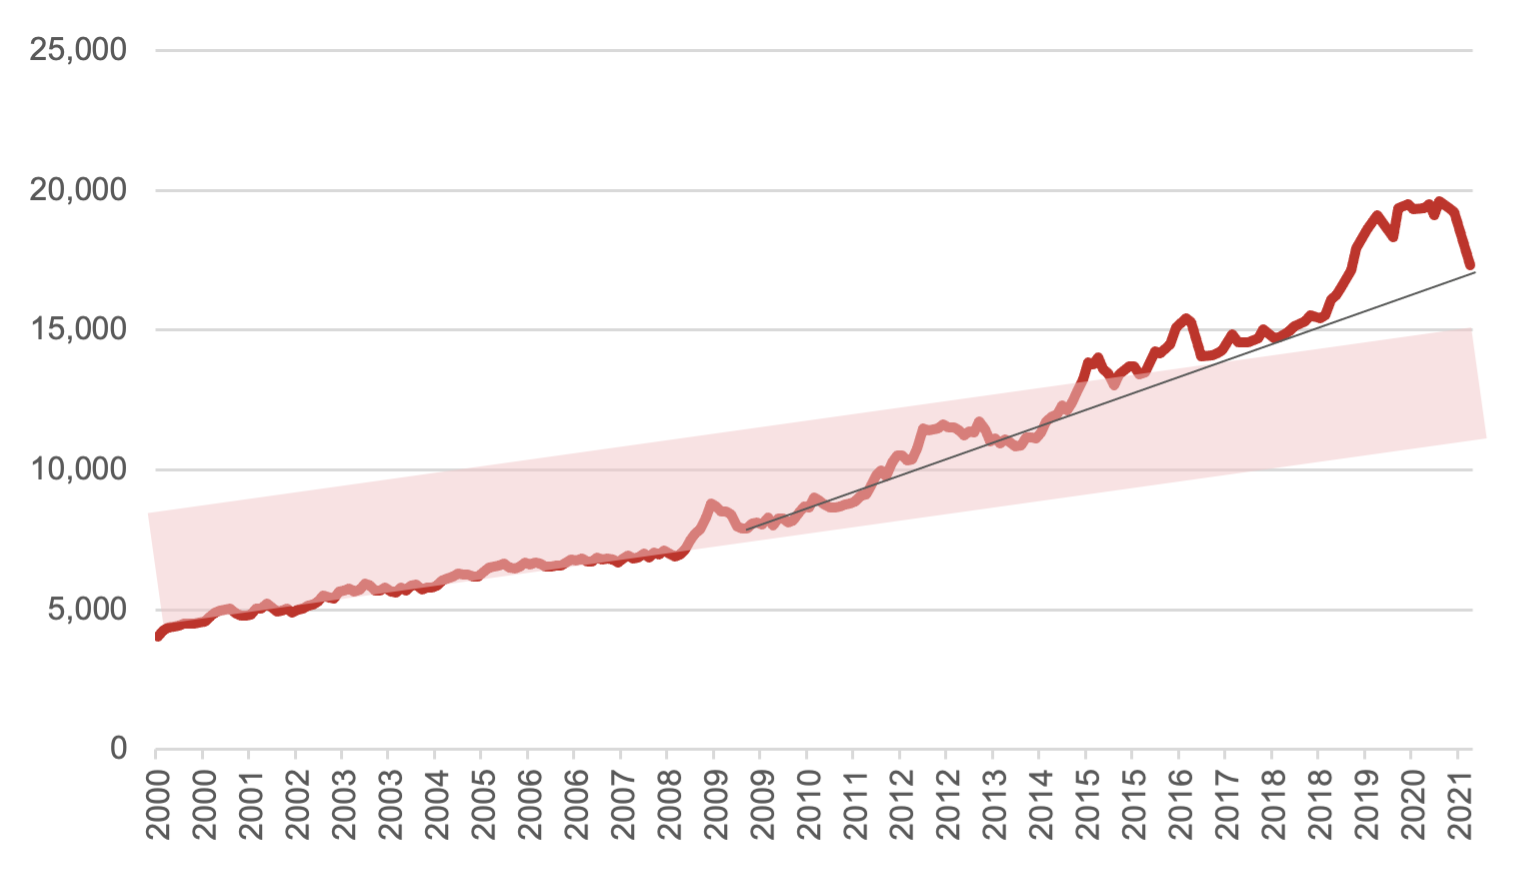
(Figure 7 – Source: BondAdviser, Bloomberg. As at 7 March 2021)
A steepening of the yield curve is not an unhealthy sign for an economy. As in this instance, it can reflect improved future growth expectations. While much attention has been focused on the long end recently, we highlight the notable action at the front to middle of the curve. The two- to five-year spread provides a good bellwether for questions of policy tightening in the near term, and whilst financial conditions remain accommodative, the speed of this widening, should it continue, may cause alarm.
With the front end anchored by central banks, the long end burdened by duration, the middle of the curve is where we would expect some relative outperformance, for those not willing to go directionally short across the entire govies curve.
No Sign of Slowing – AUD / USD Sell 2 Year & Buy 5 Year Spread
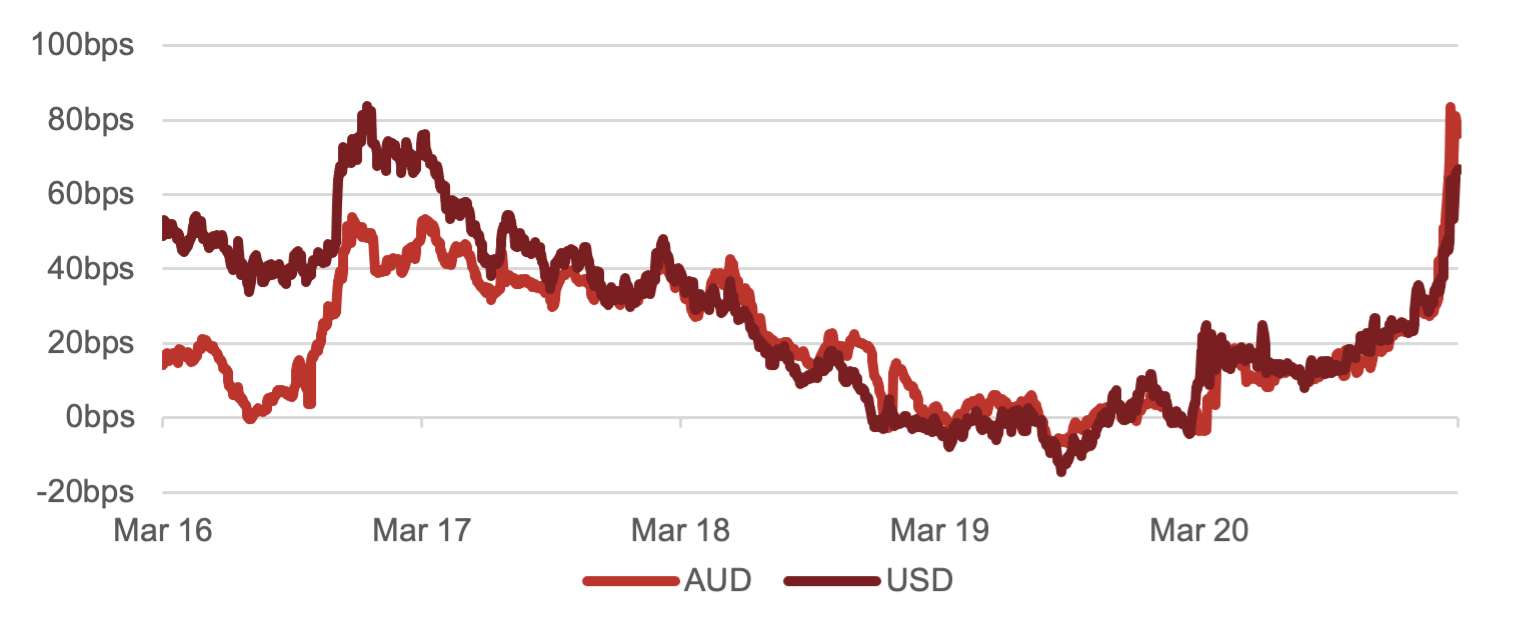
(Figure 8 – Source: BondAdviser, Bloomberg. As at 7 March 2021.)
Domestically, as we expected in January, the economic data has been strong. Consumer confidence remains at near record decade highs, even with the roll-off of JobKeeper front of mind. There is much to play out in terms of fiscal stimulus, however we do not expect the Federal Government to walk away from sectors like tourism and aviation which continued to be crippled by international travel restrictions.
Main Street Still Stoked – WBC Consumer Confidence (SA)
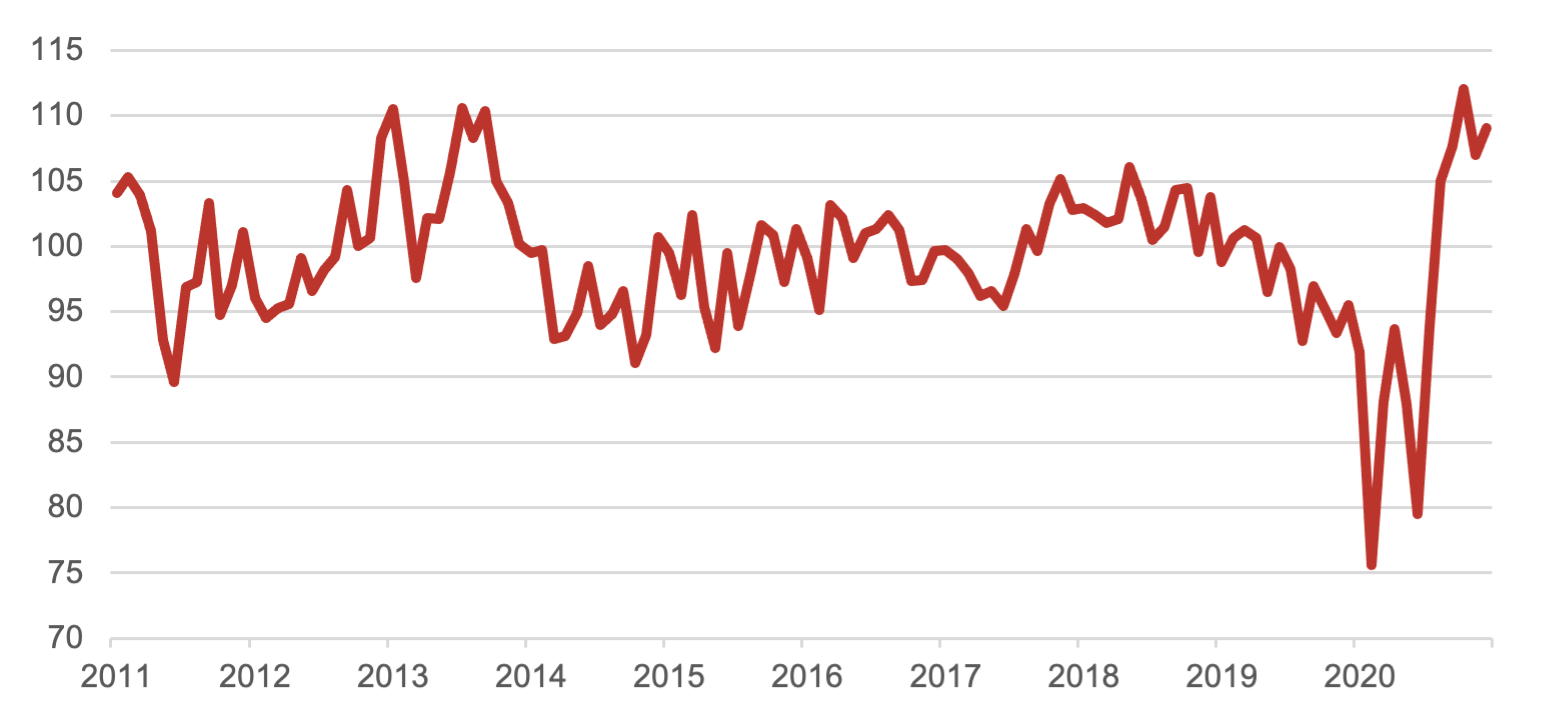
(Figure 9 – Source: BondAdviser, Bloomberg. As at 7 March 2021.)
The strong data is evidence for a rising inflationary environment, however, there are questions here in relation to the continuing weaknesses in the labour market and wage growth. Leaving this to one side, given it will take time to heal these wounds, we turn our attention to the other areas of the economy which are heating up. US PMIs for purchasing manager surveys are at 12-year highs in both the manufacturing and services sector. This has been a good leading indicator of inflation previously. Australia does one better, with its producers having a production PMI that is at its highest (albeit just) since September 1994.
Producers Purchasing Sentiment is Up – AUD AIG Production PMI
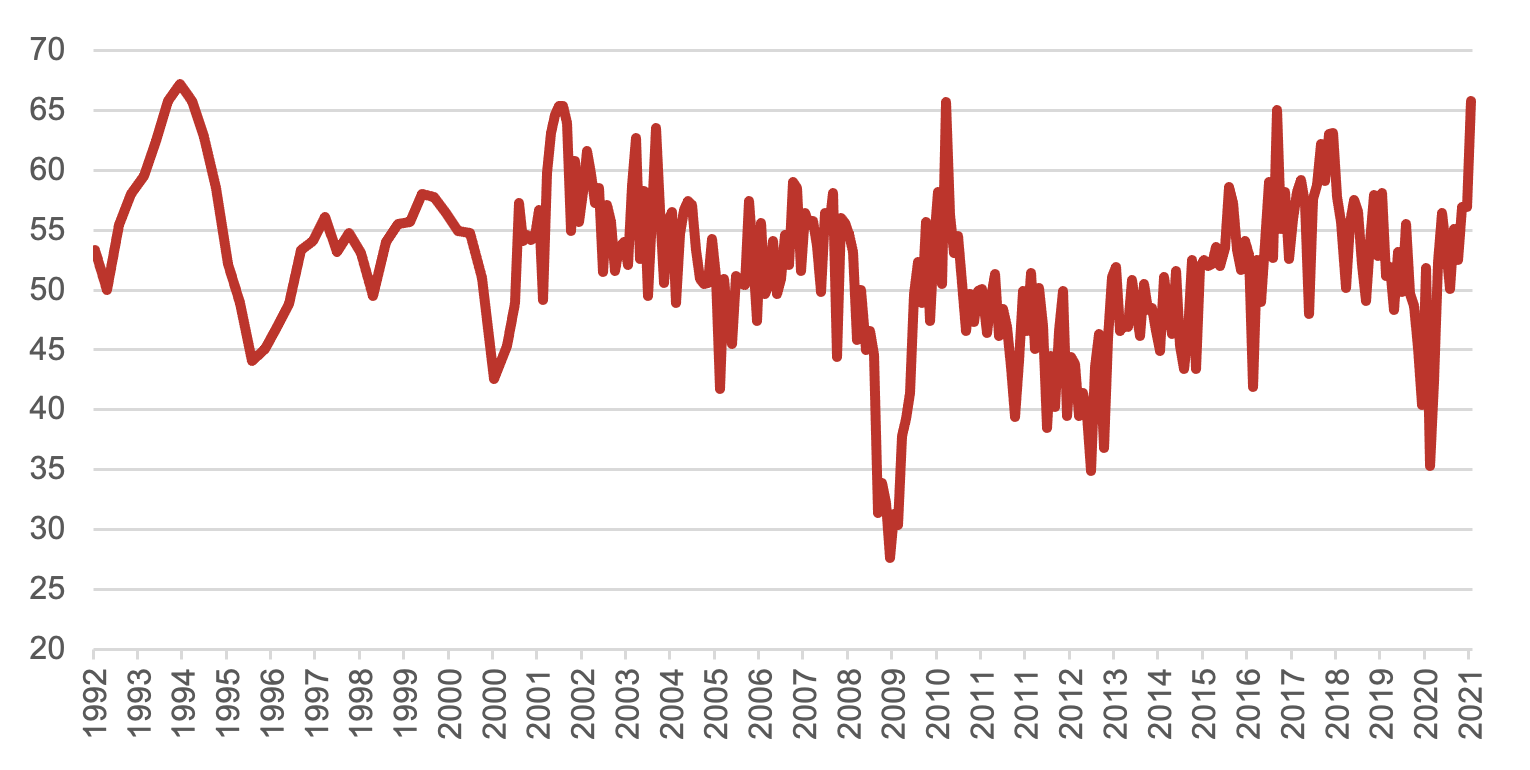
(Figure 10 – Source: BondAdviser, Bloomberg. As at 7 March 2021.)
The local property market continues to go gangbusters, which given record low mortgage rates, alongside government support, does not surprise us. With auction clearance rates high, we expect this trend to continue near term. Although, we expect regulators to place some constraints at the lending level later in the year to temper runaway prices. Should rates begin to rise, the impact to property prices will be severe, albeit delayed. Exactly like what happened in 2018, with the pick-up in 3m BBSW, but worse. Regardless, the short-term trajectory of domestic housing prices continues to be upward and given the national leverage to the housing market, government support will be fierce in the face of any weakness.
The Obsession Continues – Owner Occupier Loan Values (SA, MoM)
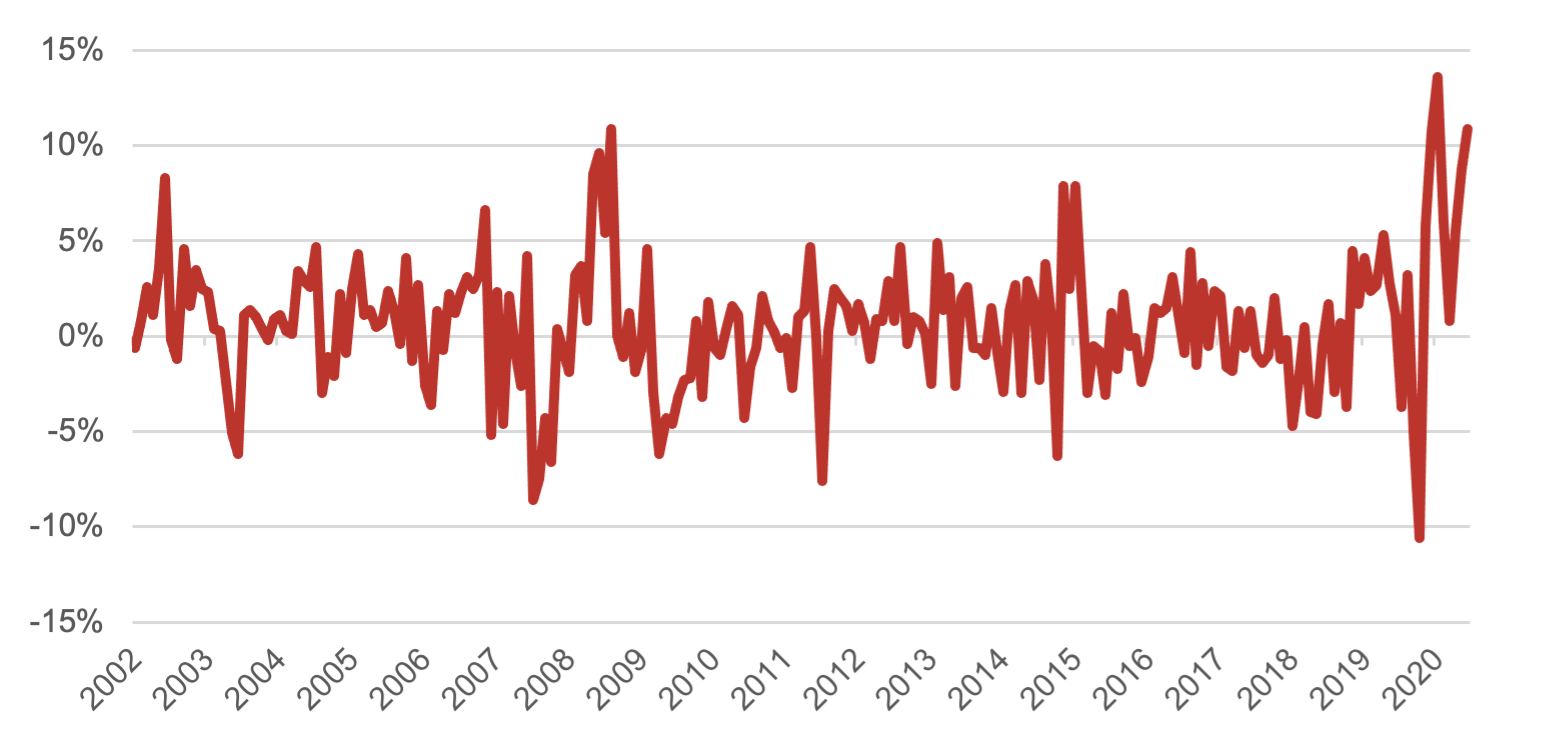
(Figure 11 – Source: BondAdviser, Bloomberg. As at 7 March 2021.)
Globally, commodity prices, which typically act as inflation hedges, are surging. Markets are searching for gains given the de-facto duration exposure of growth stocks. Excluding FRNs and linkers, commodities is a good place to hide when fearing inflation. Whilst the Bloomberg index is said to be overweight energy and the Refinitiv index underweight, both march upwards in unison.
Why Did it Have to be Snakes? Commodities Index
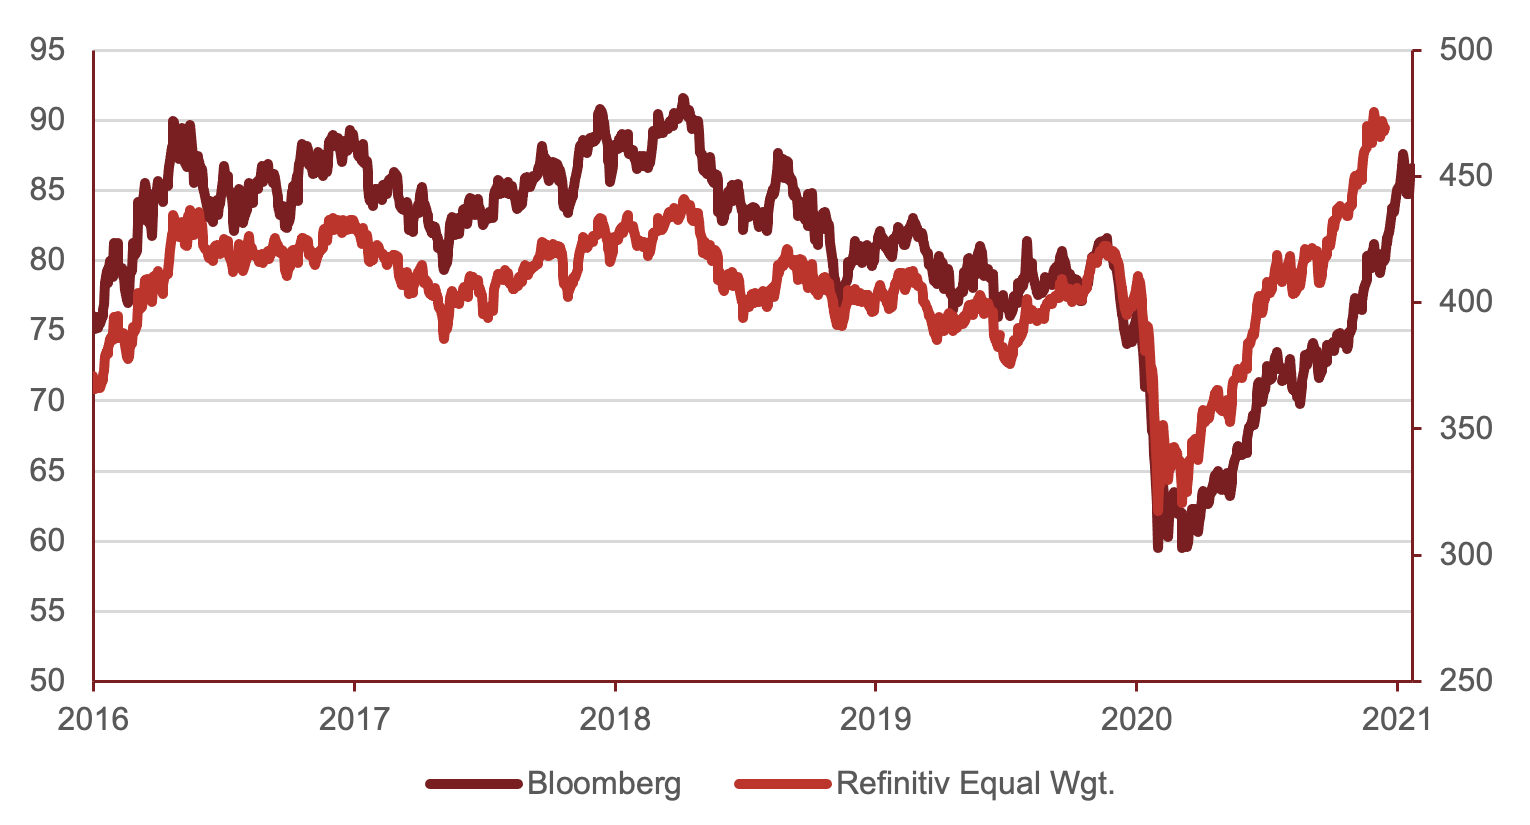
(Figure 12 – Source: BondAdviser, Bloomberg. As at 7 March 2021.)
Off the Charts – RBA Financial Aggregate Money Base YoY (NSA)
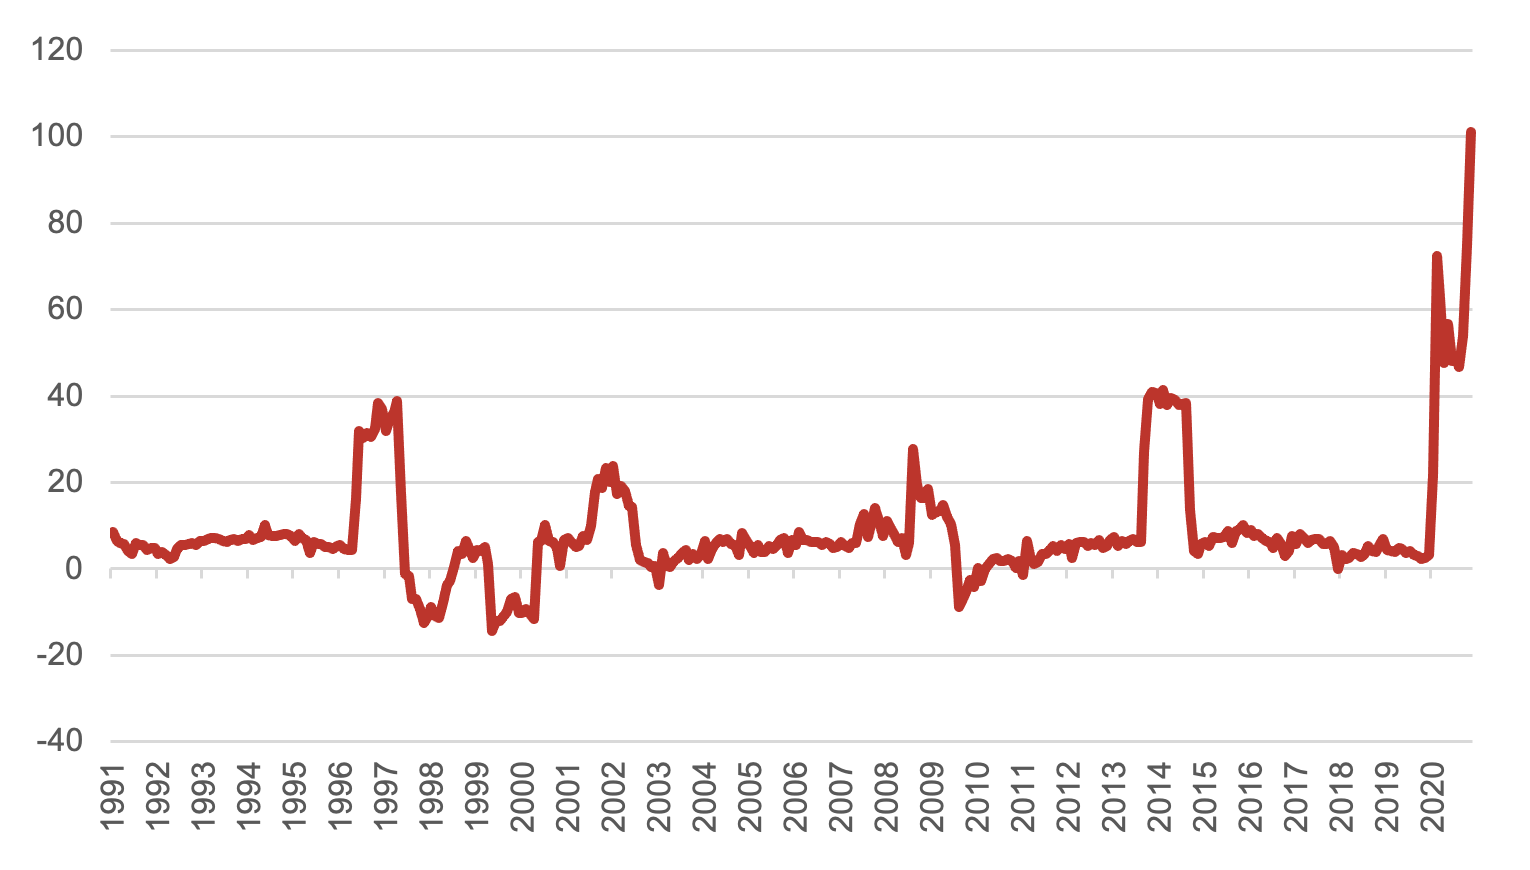
(Figure 14 – Source: BondAdviser, Bloomberg. As at 7 March 2021.)
Returning to the Peruvian temple. Our hero Indy (pick yours in Dr Lowe / Powell) has carefully navigated the elaborate booby-traps (COVID) but now finds himself in the cave being chased by a large boulder (inflation)*. Unconventional policy in addition to unquestionably massive fiscal stimulus has threaded the needle in avoiding a health crisis manifesting into an economic disaster. This is good policy.
*The scene where Indiana Jones is running away from the giant boulder was ironically inspired by Steven Spielberg’s Scrooge McDuck comics. There is nothing Scrooge McDuck about modern day central bankers. Anyway, we digress.
Anyone Home? Broad Money vs RBA CPI (YoY, SA)
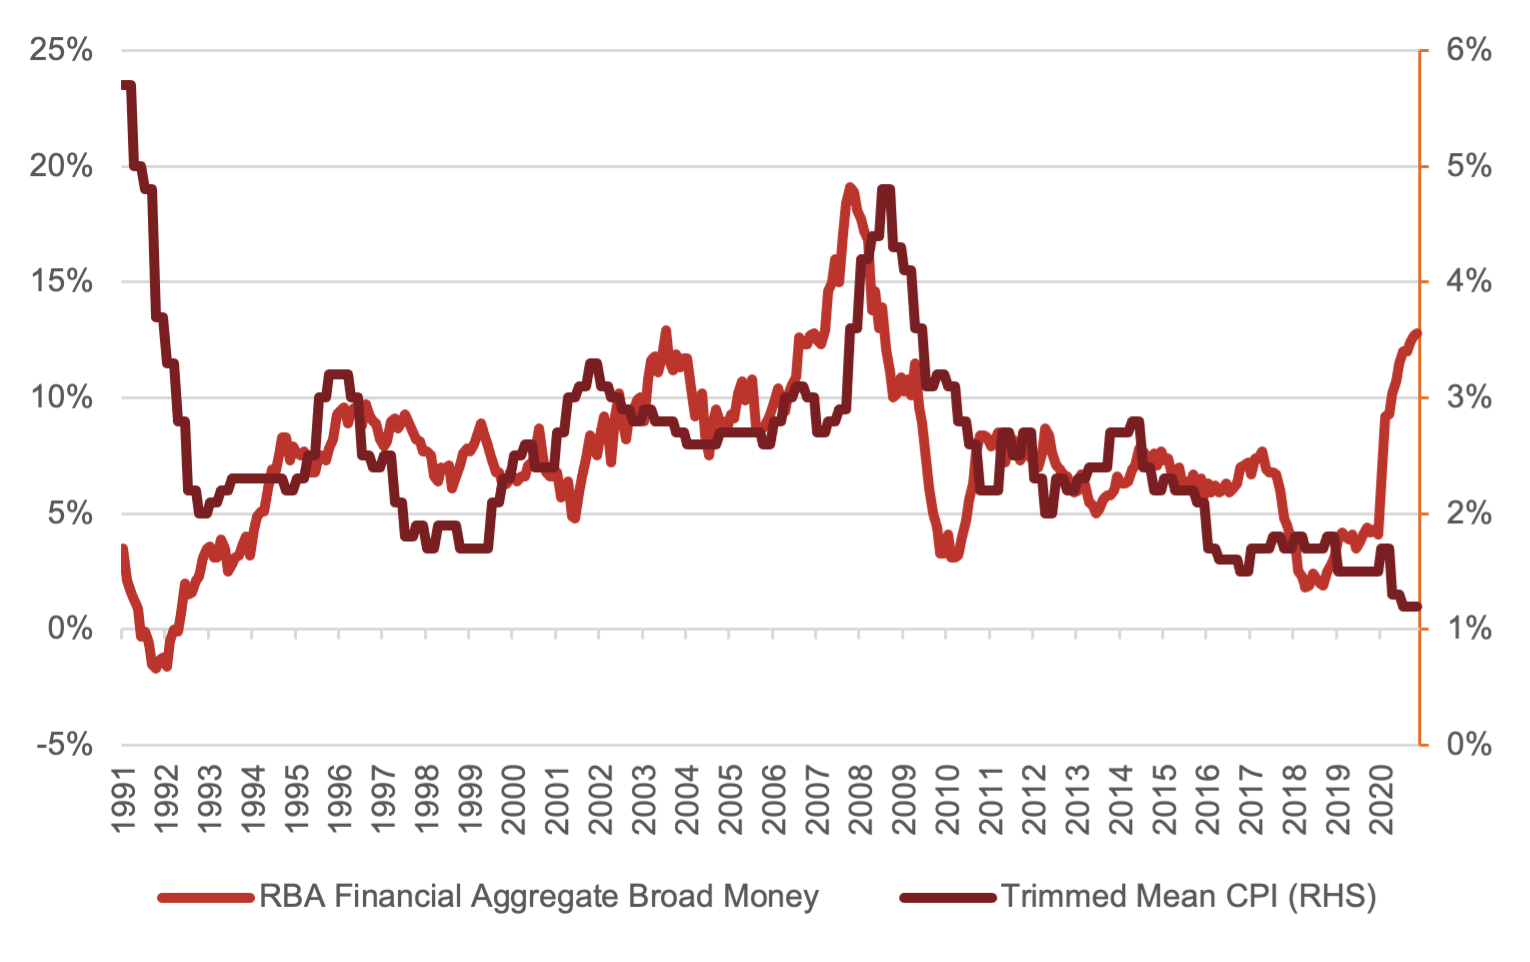
(Figure 15 – Source: BondAdviser, Bloomberg. As at 7 March 2021.)
What could be bad policy is discounting expected inflation and overestimating your ability to control it once it is out of the bag. Money in the domestic economy has surged dramatically, with money base growth off the charts. Broad money growth in the past has been a reasonable indicator of future inflation. There is a massive disconnect between the two currently.
As the boulder picks up momentum it will be harder for Indy to outrun it. With so much already spent on bond purchases, the market may lose faith in the RBA and Fed’s ability to control it. The more the central banks spend on assets, the larger the boulder becomes. The larger the boulder becomes, the faster it moves. The faster it moves, the larger the likelihood of eventually being crushed by its momentum. Without hard measures now, central banks may lose the ability to control the severe reflation sell-off later. Markets can handle an increase in yields, but only in an orderly fashion.
Despite weakness in the labour market, there are compelling signals for future inflation elsewhere in the economy. Since May, we have viewed duration as an asymmetric trade. The pain of convexity when yields rise significantly, far outweigh the benefits of compression into past lows. There will be a time this is no longer true; however, we still retain our preference for active management, linkers, FRNs and the short end in minimising duration exposure.
Author/s: Charlie Callan
Responsible Manager: John Likos
General Disclosures
BondAdviser has acted on information provided to it and our research is subject to change based on legal offering documents. This research is for informational purposes only.
This information discusses general market activity, industry or sector trends, or other broad-based economic, market or political conditions and should not be construed as research or investment advice.
The content of this report is not intended to provide financial product advice and must not be relied upon as such. The Content and the Reports are not and shall not be construed as financial product advice. The statements and/or recommendations on this web application, the Content and/or the Reports are our opinions only. We do not express any opinion on the future or expected value of any Security and do not explicitly or implicitly recommend or suggest an investment strategy of any kind.
The content and reports provided have been prepared based on available data to which we have access. Neither the accuracy of that data nor the methodology used to produce the report can be guaranteed or warranted. Some of the research used to create the content is based on past performance. Past performance is not an indicator of future performance. We have taken all reasonable steps to ensure that any opinion or recommendation is based on reasonable grounds. The data generated by the research is based on methodology that has limitations; and some of the information in the reports is based on information from third parties.
We do not guarantee the currency of the report. If you would like to assess the currency, you should compare the reports with more recent characteristics and performance of the assets mentioned within it. You acknowledge that investment can give rise to substantial risk and a product mentioned in the reports may not be suitable to you.
You should obtain independent advice specific to your circumstances, make your own enquiries and satisfy yourself before you make any investment decisions or use the report for any purpose. This report provides general information only. There has been no regard whatsoever to your own personal or business needs, your individual circumstances, your own financial position or investment objectives in preparing the information.
We do not accept responsibility for any loss or damage, however caused (including through negligence), which you may directly or indirectly suffer in connection with your use of this report, nor do we accept any responsibility for any such loss arising out of your use of, or reliance on, information contained on or accessed through this report.
© 2021 Bond Adviser Pty Ltd. All rights reserved.
