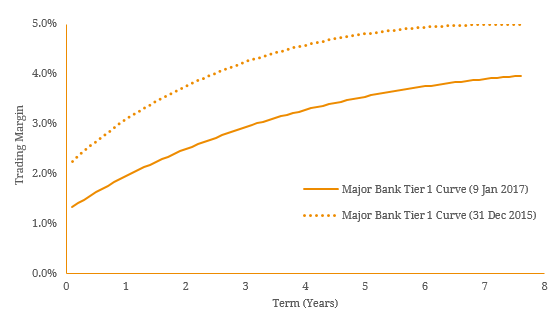
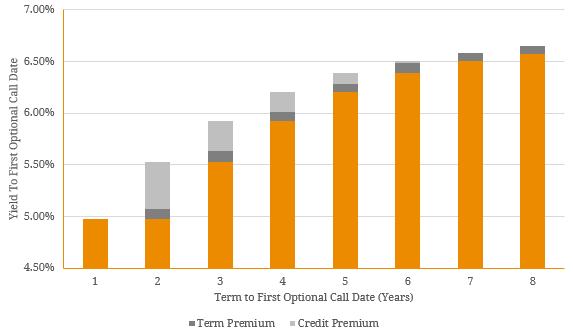
In 2016, hybrids rebounded strongly following a weak first quarter to finish the year up 9.2%. This was driven by tighter credit spreads as both institutional and retail investors showed particularly strong support for hybrids. This rally was primarily driven by technical factors due lack of new supply during the second half with a number of corporate issuers choosing to not refinance maturing securities. The floating rate note format of hybrids also offered investors protection against rising bond yields sparked by the shock-election of presidential candidate Donald Trump. This is due to the fact that interest rate typically resets either on a quarterly or semi-annual basis depending upon the terms of the security (i.e. not fixed). Taking a closer look, Figure 1 shows how the hybrid credit curve shifted both lower and flattened over the year as both mid-dated and longer-dated hybrids generally outperformed their shorter- dated peers (Figure 1). Figure 1. The Bank Hybrid Credit Curve Shifted Lower and Flattened Over 2016.  Source: BondAdviser Figure 2 shows the relationship between individual hybrid security returns over 2016 against the term to the 1st optional call date (as at 31 December 2016). Although most of the hybrids that generated a return greater than 10% over the year had a term to 1st optional call of 3-6 years, this was not a guarantor of out-performance as there were also a number of laggards. For this reason, it is important to consider the relative value of individual securities when assessing whether to buy, hold or sell an individual security (see Figure 3). Figure 2. 2016 Return versus Term to 1st optional call date.
  Source: BondAdviser Figure 3. Hybrid Credit Curve (as at 9 January 2016).
  Source: BondAdviser Figure 4 shows the average trading margin of major bank hybrids since 2006. History shows the compression of hybrid trading margins during 2016 has been rapid and appears to be approaching post-GFC lows. Figure 4. Historical Average Major Bank AT1 Hybrid Trading Margin
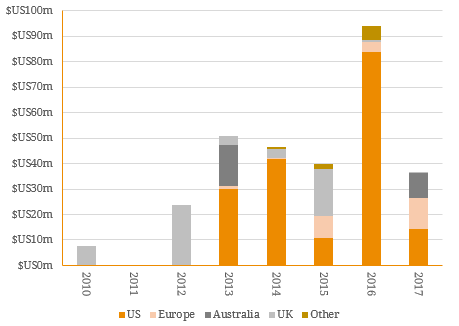
  Source: BondAdviser Although we may suspect a correction on the horizon, supply side dynamics are expected to remain supportive during 2017 (see Figure 5) as there is only one issue due to be called and replaced (ANZ Convertible Preference Shares 3, ASX Code: ANZPC on 1 September 2017). When the replacement hybrid is announced by the ANZ we expect the term to the 1st call date to be either late 2024 or early 2025 as:
- There is no regulatory benefit to be gained by issuing a hybrid less than 5 years.
- The ANZ already have hybrid securities due to be called during March 2023 and March 2024.
That being said, we are unable to completely rule out one or more of the major banks taking the opportunity to surprise the market by announcing a new hybrid transaction during 2017 to continue increasing overall capital levels. This will be more likely if longer dated (more than 5 years) hybrid trading margins continue to compress lower and as a result, the funding cost of issuing a new security is lowered further. Figure 5. Major Bank AT1 Hybrid Expected Call Date Profile  Source: BondAdviser Conclusion The compression of hybrid trading margins during 2016 has been rapid compared to the previous two cycles. Although not quite there yet, the average trading margin of ASX listed hybrids is approaching post-GFC lows. Whilst supply side dynamics remain supportive of continued trading margin compression during 2017 this may become less so as the year progresses, especially if longer dated hybrid trading margins compress below 3%. At these levels, the major banks may choose to issue new hybrid securities and supply side pressure will emerge putting upward pressure on margins. For this reason, there could be a potential argument to sell at the long-end of the bank hybrid curve as these securities are typically more sensitive to new long-dated issuance but we remain vigilant for further compression from technical factors for greater conviction in our recommendations.

