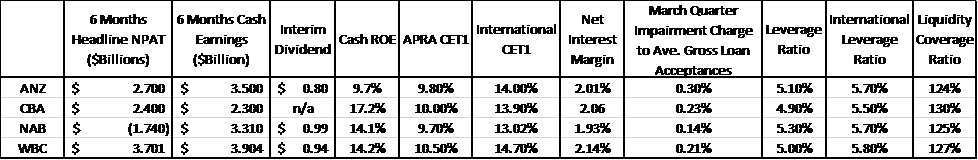
The March 2016 quarter (1Q16) major bank reporting season kicked off last Monday with Westpac and ended with the Commonwealth Bank of Australia this morning. Across the sector profit growth was mixed with both ANZ & the NAB’s headline Statutory Net Profit/Loss after Tax (NPAT) being dragged down by various one-off write downs. Westpac was a picture of stability last week, although they did potentially miss an opportunity to lower equity investor’s dividend expectations as the ANZ did a day after. WBC has so far been able to maintain profitability whilst increasing margins against the backdrop of the deteriorating commercial loans environment due to lower commodity and energy prices. The underlying performance of the consumer and business banks were solid over the half although we note that the New Zealand and institutional bank Net Interest Margin’s (NIM) declined (by 0.12% to 2.15% and by 0.07% to 1.71% respectively). Over recent months we have seen all four major banks respond to the regulator’s demands that the banks tighten their lending criteria and demonstrate that the actual assessment process for new residential mortgages is beyond reproach for owner occupiers and investors alike. Click here to see the research reports. ANZ’s headline NPAT fell 22% due to specified write downs relating to a change in their software capitalisation policy, increased Asian bank impairments & other group restructuring costs. NIM was pressured, falling 0.01% over the half with the bank only passing on 0.19% of the RBA’s 0.25% official cash rate cut last Tuesday. ANZ remains one of the most exposed Australian banks to primary industry borrowers, with the resources and agricultural portfolios representing 2.2% & 3.9% respectively of the group total. ANZ’s new CEO (Shayne Elliot) has begun the process of repositioning the business with further asset disposals and reviews expected to take place over the foreseeable future. ANZ also became the first major bank to cut the interim dividend by 7%, a move that the other three major banks have yet to follow. This reflects a more sustainable dividend payout ratio going forward and acknowledges that headwinds are expected in the foreseeable future. Click here to see the research reports. NAB’s reported a headline Statutory Net Loss due to the costs associated with the demerger and initial public offering of the UK based Clydesdale Bank (CYBG). This has been a long process for the NAB but a welcomed one as investors now have a much simpler & more focussed business strategy. NAB’s NIM improved by 0.03% to 1.93%, but remains the lowest of the major banks. We are comfortable with the current CEO’s (Andrew Thornburn) strategy of shifting towards a capital light business model and demonstrating that the leadership team are pro-actively addressing the issues of the business in a way which to date have been creditor friendly (a positive for debt and hybrid investors). Click here to see the research reports. This morning the CBA released their March Quarter trading update. Cash earnings for the quarter reached $2.3 billion (NPAT of $2.4 billion). Operating income was similar to 1H16, although trading income was up slightly. Lending volumes (home) have been consistent with recent trends, while business lending growth remains at mid-single digit levels. NIM was largely unchanged. Loan impairment costs were $427 million, or 0.25%, which is up from 0.17% as at 1H16, but remains below the sector (major banks) long run average of 0.45%. As with the other three major banks, the increase in impairments has been driven by a small number of institutional exposures. Consequently, group troublesome and impaired assets rose slightly to $6.3 billion (versus $5.9 billion, December 2015). Individual provisioning increased to $1.0 billion from $909 million as at December 2015, while collective positioning was $2.9 billion (versus $2.8 billion December 2015). Group CET1 is at 10.0% (or 13.9% on an international comparable basis), up 0.50% on December 2015 after excluding the impact of the 2016 interim dividend. The leverage ratio was 4.9% (APRA) or 5.5% (International). The Liquidity Coverage Ratio (LCR ) was strong at 130% vs 123% (Dec-15). The below table shows some of the key 1Q16 numbers for the major banks.  Source: Company reports
An employee-owned financial services provider focused on the Debt Capital Markets.

An employee-owned financial services provider focused on the Debt Capital Markets.
© Jun 25, 2026Bond Adviser Pty Ltd ‧ ASFL 456783 ‧ ABN 31 164 148 467 ‧ Important Information
This site is protected by reCAPTCHA and the Google Privacy Policy and Terms of Service apply.
© Jun 25, 2026Bond Adviser Pty Ltd ‧ ASFL 456783
ABN 31 164 148 467 ‧ Important Information
This site is protected by reCAPTCHA and the Google Privacy Policy and Terms of Service apply.