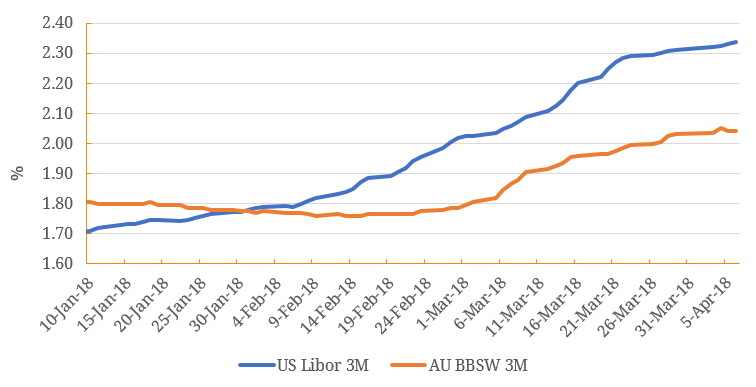
Since March this year, the benchmark local borrowing rate for Australian banks – the Bank Bill Swap Rate (BBSW) has risen sharply from ~1.80% to over 2.00% as we type, reflecting higher bank funding costs. In the meantime, USD funding costs as represented by the London Interbank Offer Rate (LIBOR) have also risen significantly, after surpassing BBSW since January this year (Figure 1). Figure 1. US$ LIBOR vs BBSW  Source: BondAdviser, Bloomberg The rate of LIBOR’s rise warrants attention, as it has not only fed through the Supranational/Sovereign/Agency (SSAs) markets and semi-government bonds, but also affected markets overseas including Australia. The spread between LIBOR and BBSW has reached a level far exceeding anything seen since the GFC (Figure 2). Figure 2. US$ LIBOR vs BBSW Spreads (US$ LIBOR – BBSW) Since Global Financial Crisis
  Source: BondAdviser, Bloomberg What is driving the strong recent up moves? For starters, there is the macroeconomic trend – the Fed has been steadily raising short term rates and scaling back quantitative easing, taking the Fed Funds rate above the RBA cash rate for the first time in 20 years, and bank funding costs have duly followed. The market has been building that expectation into rates over the last two years, and that is principally why the US$ LIBOR rate has been steadily rising from its historical lows. What about the other major component of LIBOR – default and liquidity risk premiums of banks? Are the major global banks who submit their LIBOR quotes now perceiving each other as more risky to lend to? There seems to be no credit-related reason to believe so, at least in the short term and liquidity fears are also unlikely to be realised. Given that the rate of LIBOR increases has clearly accelerated since February/March indicates to us that more tactical factors maybe at play – since 4 February 2018, a dramatic surge in US T-bill (short-term) issuance has been the dominant scene in the market. A total of $450 billion of T-Bills have been issued, forming the vast majority of all treasury securities issuance during this recent period (Figure 3). Figure 3. T-Bill Issuance Gross vs Net
  Source: BondAdviser, U.S. Department of the Treasury, Bureau of the Fiscal Service At the other end of the curve, $94 billion of longer-dated treasury notes and bonds were sold across the 2, 5, 7 year maturities, collectively forming a small minority of all issuance (Figure 4). Figure 4. Treasuries Issuance Bills vs Notes vs Bonds
  Source: BondAdviser, U.S. Department of the Treasury, Bureau of the Fiscal Service This unusual spike in new T-Bills however, will inevitably recede, possibly as soon as we move towards the end of April, which should flow through to some recovery in broader market sentiment as well. However, the winding back of quantitative easing should remain the dominating force, keeping spreads wider going forward. Apart from Fed policy, the upward trend in funding costs may encounter other headwinds. Although the outlook for US economic growth remains strong with a double dose of fiscal stimulus—tax cuts and higher government spending caps, trade tensions with major trading partners could counterbalance growth-inducing fiscal impulses. Secondly, a less-talked about aspect – the repatriation of profits from overseas subsidiaries of US multinational corporations under a “repatriation tax holiday”, or a window of time in which US corporations could transfer profits held by offshore subsidiaries to domestic holding companies and pay a federal corporate income tax lower than the current statutory 35%, may be an extra counterbalancing force. US companies are estimated to have about $2.5 trillion in profits held by offshore subsidiaries which have not yet been taxed in the US. That translates to roughly $735 billion in deferred tax liabilities at the 35% statutory rate. Even a partial repatriation, or simply a decrease in future profits retained in foreign subsidiaries, would likely generate non-trivial amounts of revenue for the federal government and some states. In the case of a highly-utilized tax-holiday it could create a substantial windfall which would, absent one-time spending, reduce the issuance of treasuries, at least in the short-term. As we discussed previously in our UPSS Market – Why Do We Care? case study, rising bank funding costs in the US is making funding in the US less attractive for Australian corporates. Domestically, higher BBSW rates, coupled with slow loan growth in the competitive environment and potential negative ramifications from the banking Royal Commission could also ring alarm bells. Traditional bank lending in Australia appears more and more unappealing, as interest rates and regulatory burdens both look set to be on the up. Perhaps not coincidentally, Australian packaging billionaire, Visy Industries’ Anthony Pratt has called for the nation’s A$2.63 trillion pension funds to work with traditional banks to lend directly to companies, and diversify away from their current equity-heavy model. Indeed, according to Pratt, it has been “easier to sell Visy bonds in Iowa than in George St, Sydney”. Visy last year completed a A$150 million placement of 10- year debt to Australian Super and IFM Investors. Could this finally be the harbinger of a more competitive credit market in Australia less reliant on the banks? Could super/pension funds one day join the banks in setting the benchmark rates of the future as LIBOR and BBSW undergo reforms? We will have to wait and see…
An employee-owned financial services provider focused on the Debt Capital Markets.

An employee-owned financial services provider focused on the Debt Capital Markets.
© Jul 18, 2026 Bond Adviser Pty Ltd ‧ ASFL 456783 ‧ ABN 31 164 148 467 ‧ Important Information
This site is protected by reCAPTCHA and the Google Privacy Policy and Terms of Service apply.
© Jul 18, 2026Bond Adviser Pty Ltd ‧ ASFL 456783
ABN 31 164 148 467 ‧ Important Information
This site is protected by reCAPTCHA and the Google Privacy Policy and Terms of Service apply.