Click here for a print friendly version.
Walking the Talk
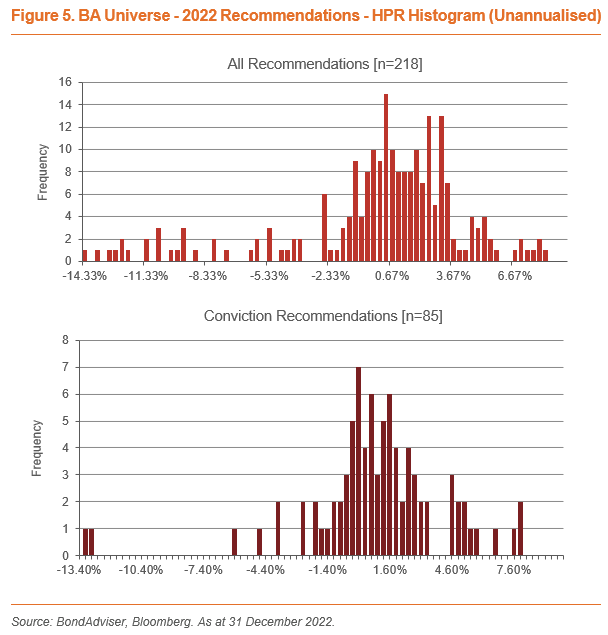
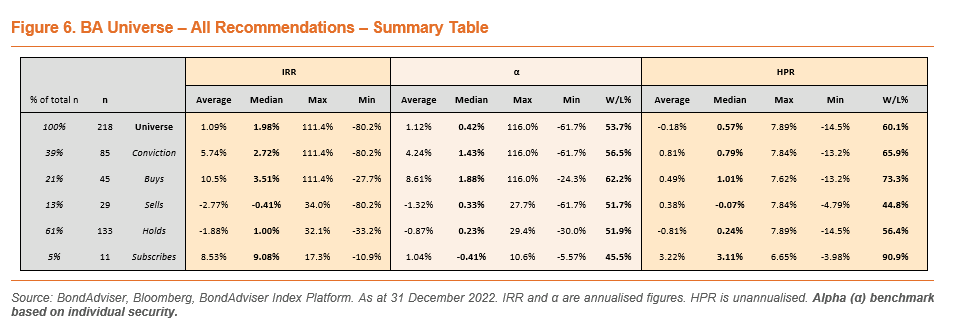
Amid one of the worst years for bonds on record, BondAdviser’s desk provided a 66% win/loss ratio for holding period returns on our Conviction recommendations. Furthermore, we averaged an internal rate of return (IRR) of 10.5% (2021: 8.8%) on our Buy (n=45) recommendations across our coverage Universe. In total for 2022 we issued 349 recommendations, across 133 unique securities and 48 different issuers.
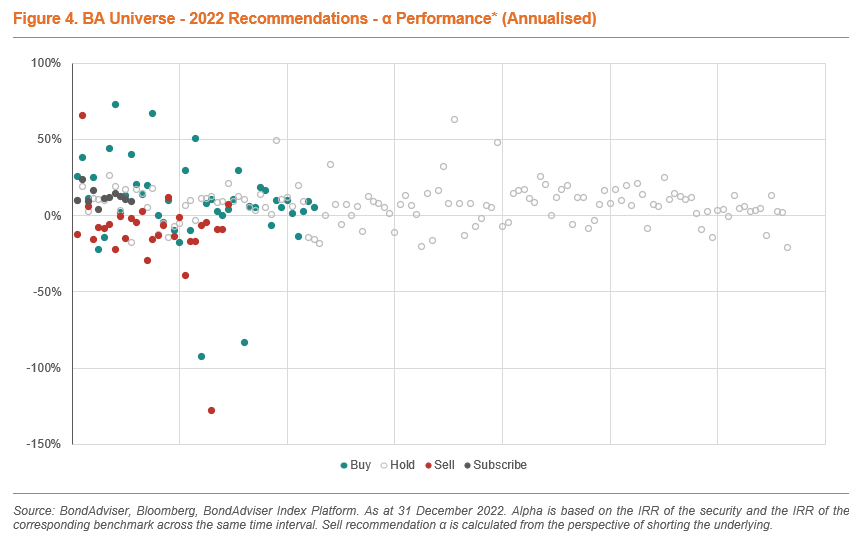
Against the respective benchmark for each security, our Conviction recommendations (Buy, Sell or Subscribe) provided alpha 57% of the time (n=85), falling marginally from 62% in 2021 despite a tumultous 2022. When using APRA’s benchmark, alpha generated in 2022 increases to 59%.
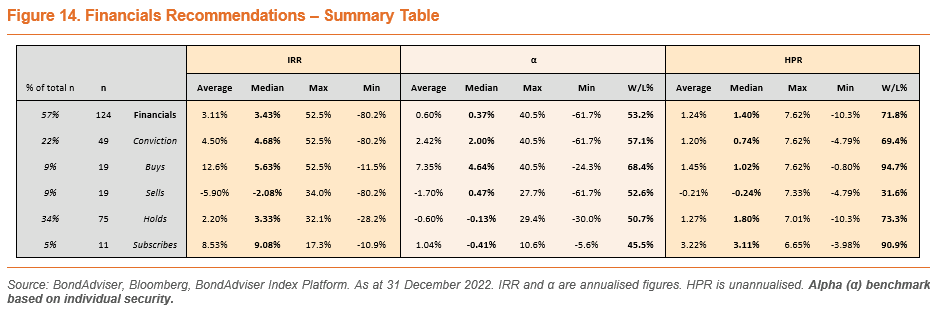
Other highlights include; (1) (i) an average alpha of 17.3% across our Buy (n=10) recommendations in High Yield, (ii) an average IRR of 12.6% across our Buy (n=19) recommendations in Financials, (2) (i) alpha generated 80% of the time across our Buy recommendations in High Yield (n=10), and (ii) a 95% IRR win/loss rate across our Buy recommendations in Financials (n=19).
In the second edition of our review, we again outline our method in reviewing performance, highlight some key charts and data, and reference the best and worst on the desk for 2022. Click here to review our 2021 edition.
Methodology
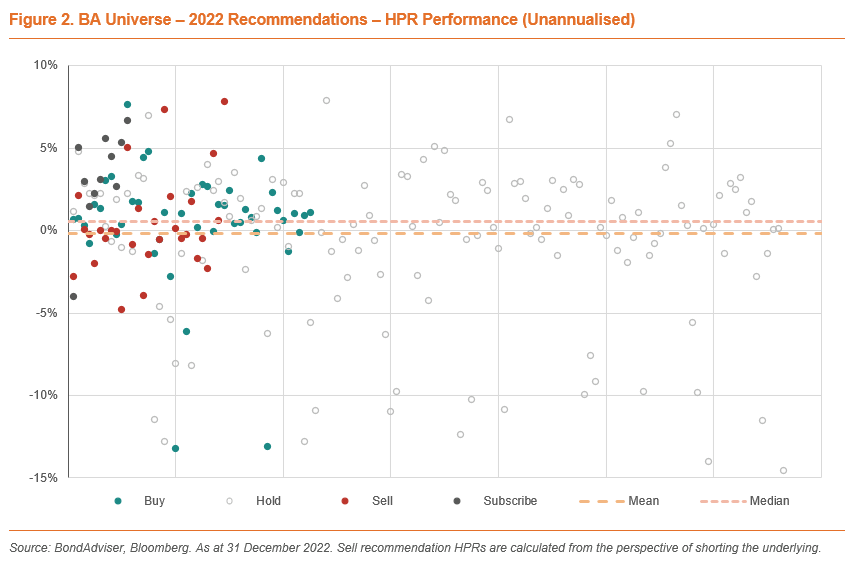
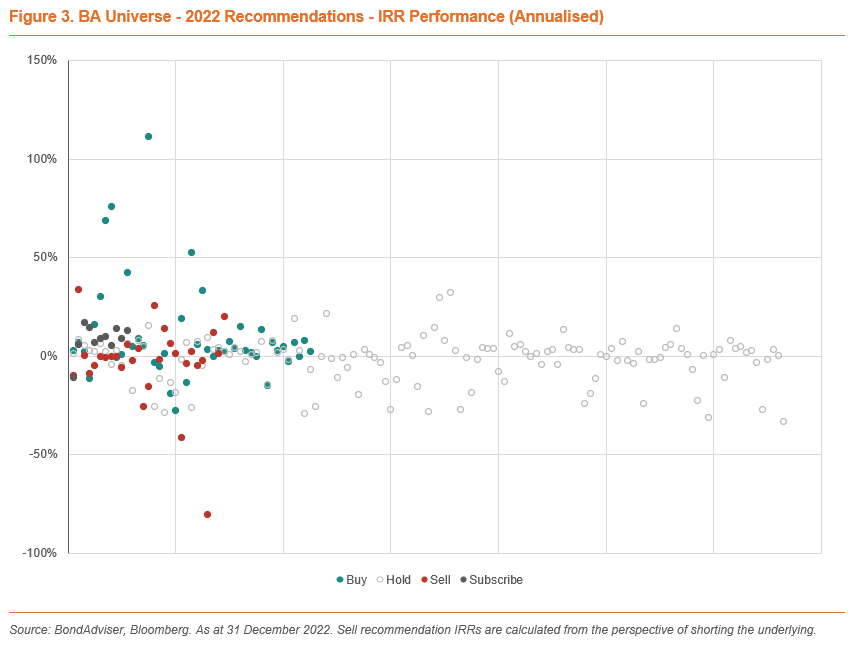
This analysis is focused on recommendations on credit securities (i.e. bonds, hybrids, and convertibles) and not our Fund Research. All BondAdviser recommendations are timestamped and stored externally in digital format. Such data has been extracted and performance has been calculated in the form of both the unannualised holding period return (HPR) and the annualised internal rates of return (IRR). The start date of performance is determined by the date of a change in rating. The final date of performance is also determined by the date of a change in rating, or where such date is not applicable; the maturity/call date. In the event of the security remaining outstanding, the final date used for calculations is the last trading date of the year.
This accounts for why the analysis pool consists of 218 recommendations, whereas the total amount of recommendations for the year was 349. The “missing” recommendations, for example, is where a security has a Hold recommendation and new research is published, with the recommendation unchanged as a Hold. We make this distinction in a better attempt to model hypothetical portfolio performance.
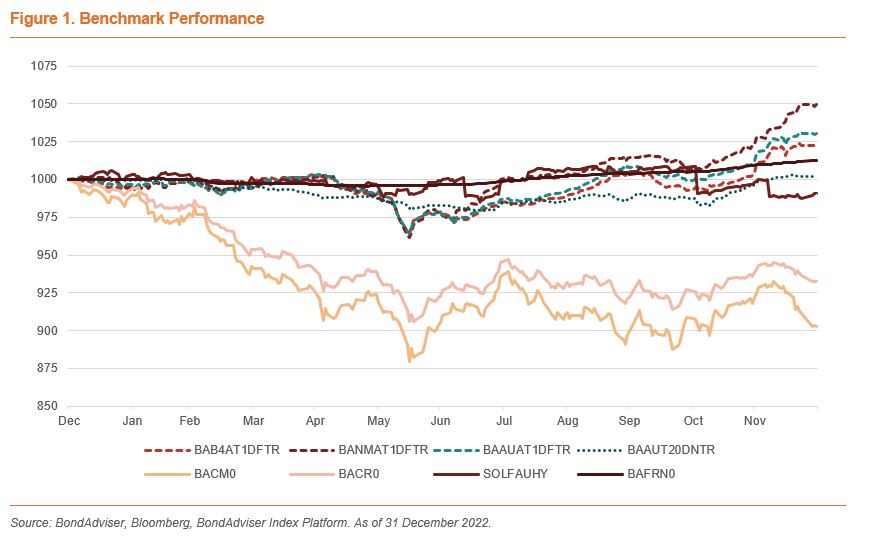
In determining alpha (α), we have opted to be more granular with our assessment – compared to that of simplifying the analysis with a broadly used benchmark metric such as the AusBond Composite Index (BACM0). In using a more characteristic benchmark than BACM0, generally, our investment grade securitites that are fixed rate are compared against the AusBond Credit Index (BACR0); investment grade floating rate securities are compared against the AusBond Credit FRN Index (BAFRN0); while high-yield or non-rated securities are compared against the Solactive FIIG Australian High Yield and Non-Rated Bond Index (SOLFAUHY). Our alpha calculations use the IRR of both the benchmark and the security recommendation over the time period of the recommendation.
Otherwise, regulatory capital is compared against our proprietary Index Platform, which uses a rules-based, market-weighted calculation of total return (on a franked basis where applicable). Tier 2 securities are compared against the AUD-denominated BondAdviser Australian Tier 2 Index (BAAUT20DNTR), which excludes issuers of risk outside that of Australia and New Zealand. AT1 Hybrid Securities are compared in two formats, firstly, against that of the Australian issuer, AUD-denominated market (BAAUAT1DFTR) and secondly, against a more comparable risk profile, split up by the Big Four Banks (BAB4AT1DFTR) and the Non-Majors (BANMAT1DFTR). Unlike all the other benchmarks, these two differ slightly in that securities must have an expected term to call of greater than a year.
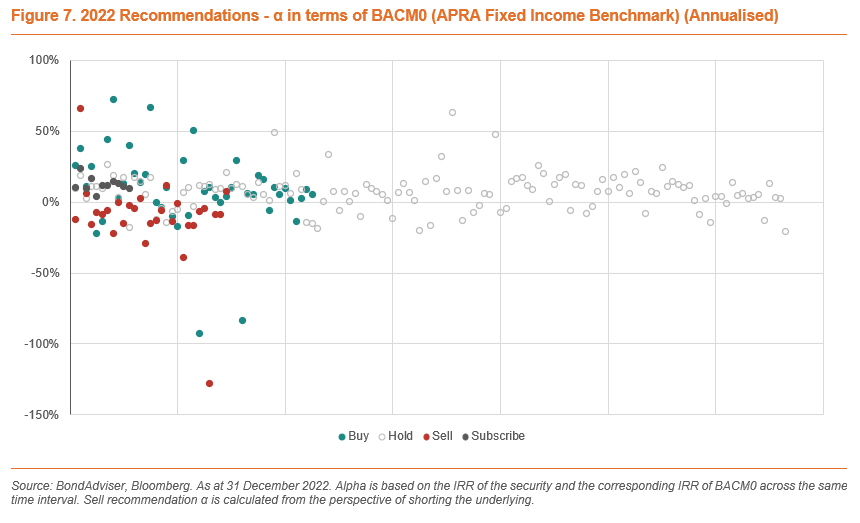
We have used BACM0 as a low watermark in some charts for reference. Additionally, exclusive to Figures 7-8, we have calculated alpha differently, based on APRA’s requirements of using BACM0 as the benchmark.
Analysing the Research Team’s results is done across multiple criteria, including nominal returns, time adjusted returns, and opportunity costs. Furthermore, we separate recommendations by type; in terms of Subscribe, Buy, Hold, and Sell. Lastly, we separate by sub-asset type. It is worth noting a Subscribe recommendation is different as it is a primary market recommendation, while Buy, Hold and Sell all apply to secondary markets. In 2022, we issued 11 Subscribe recommendations and did not issue any Do Not Subscribe recommendations. Across 2022 we crystalised 45 Buys, 29 Sells, and 133 Holds.
In terms of sub-asset classes, we have split our research universe into three main groups: 1) Investment Grade vs High Yield, 2) Financials vs Corporates and 3) for subordinated financial capital (AT1 hybrids and Tier 2) we have Big Four Banks vs Non-Major Banks and Financials.
Benchmarking Against Your Future, Your Super
Whilst our first piece of alpha analysis assigns benchmarks to each trade based upon our methodology, Figures 7 and 8 display our relative performance to the catch-all fixed income index stipulated by APRA, the AusBond Composite Index. The Index is widely known but is not necessarily the best indicator of relative performance on a broad basis across all securities as it is largely composed of government bonds (and consequently also duration-heavy). As a result of consistently rising inflation (and therefore interest rate) expectations, the index posted some of the worst monthly returns on record across the year – and was down 9.7% over the calendar year – the worst since records began in 1989. Further, given 2022 was one of the most volatile years for bonds in decades, large short-term swings drove large annualised movements.
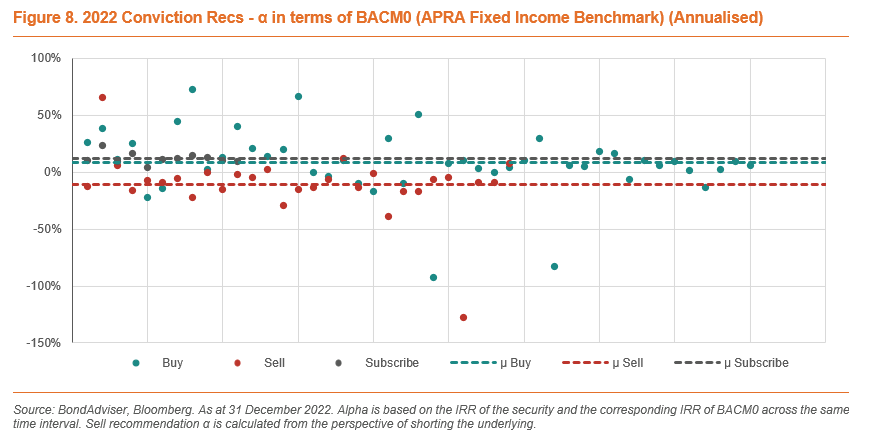
Under such benchmarking criteria, our relative performance on Buy recommendations was robust; with an 8.16% mean and 9.21% median alpha recorded across 45 recommendations, with a 76% win/loss rate. The relative performance across our 11 Subscribe recommendations was even stronger; with a 100% win/loss rate and an average and median alpha of 12.17% and 11.40% respectively.
Our relative performance on our Sell recommendations, however, was considerably weaker. The average and median alpha across our 29 Sell recommendations were -10.61% and -8.61% respectively, with a 17% win/loss rate. As performance for the BACM0 was poor, returns from the perspective of shorting the Index were large. This results in the alpha on Sell recommendations having a high benchmark to beat as a result of BACM0’s weighting to duration-heavy government securities. Where our significant underperformance to this benchmark occurs is in floating-rate hybrids, which are less sensitive to interest rates (implying returns will be less from a short position than duration-heavy indices where rates are rising, as was the case in 2022). Additionally, one difficulty faced across Sell recommendations for AT1 securities has been timing: investors have shown to be somewhat irrational in purchasing historically rich AT1 securities which presented poor relative value (oftentimes providing less yield than the risk-free rate). Further, demand for AT1 securities can often be excessive when a security nears maturity as investors purchase to be preferentially allocated into new IPOs. 2022 was a humbling experience for many including us, and preferential allocation buying to the point of negative spreads is something we will be especially cognisient of in the ASX listed-debt market going forward.
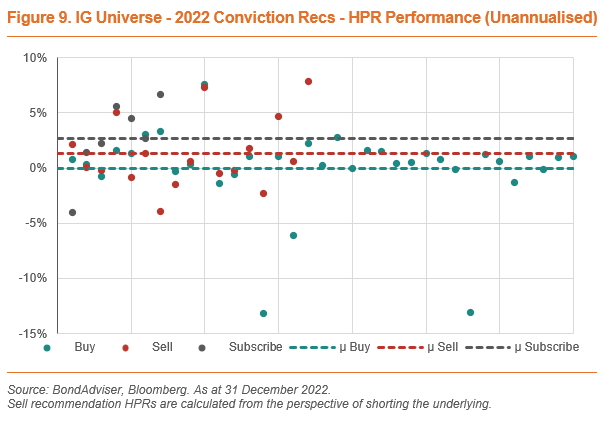
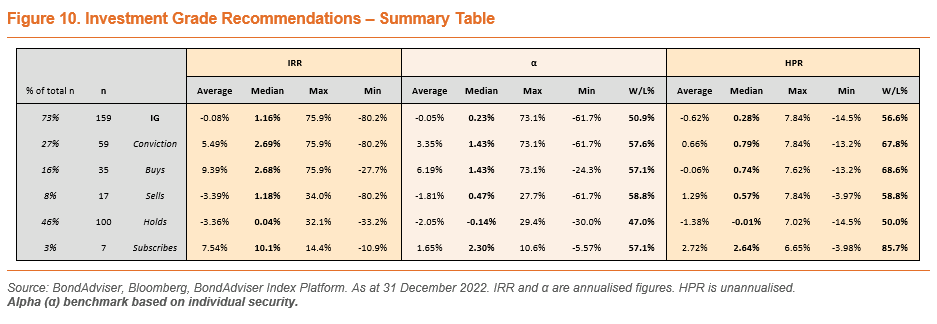
Investment Grade – Mixed Results Amid Spread Widening & Rate Volatility
Performance was varied across the Investment Grade space, as this combines our short-term trading recommendations on AT1 securities alongside short-medium term recommendations across the Corporates sphere. Importantly, most AT1 hybrids are floating-rate whilst IG corporates typically issue fixed-rate securities as a way to hedge the company’s interest expense, which understandably drives a higher standard deviation in returns across this particular space given the level of rates volatility over the year.
Our best performing recommendations across AT1 hybrids (MQGPF & MQGPC Buy: 33.0% and 52.5% IRR) were offset by poor performance across Hold recommendations on conglomerate Wesfarmers’ fixed-rate securities being the 2028 and 2031 Sustainability-Linked Bonds (-22.4% and -31.0% IRRs). The performance here is marginally better compared to the AusBond Credit benchmark; with -9.8% and -15.4% alphas.
As discussed later in the Corporates section, some of our worst performing recommendations were on Buy recommendations across long-duration corporate bonds. These recommendations were made on strong value on a relative basis to other secondary-traded securities, which unfortunately did not eventuate given all securities across the curve sold off. Later, we discuss that many ultra-heavy duration exposures were caveated with a suggestion to hedge interest rate risk – which would have limited losses arising from rising risk-free rates.
Additionally, both positive and negative returns that were larger than the mean were a function of the length of time between recommendation change. Given corporate bonds are typically paper-traded less frequently, holding period returns can be largely negative or positive (this was inflated by the volatility present in 2022). This is because the length of our recommendations vary; we frequently change AT1 recommendations reflecting faster movements in spreads (higher beta), and as such unannualised returns across these securities in the investment grade space were considerably smaller, even if their return was strong over a small time period – which is recognised in the IRR.
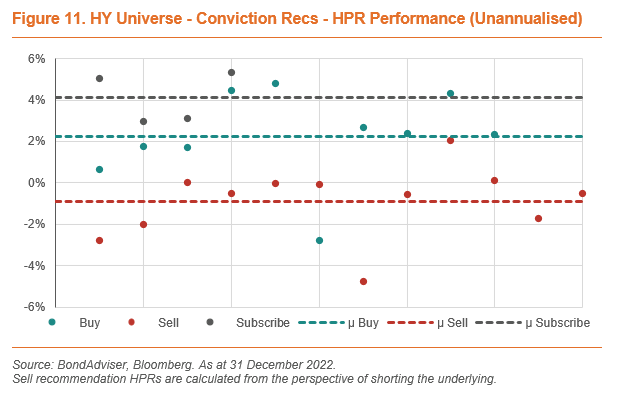
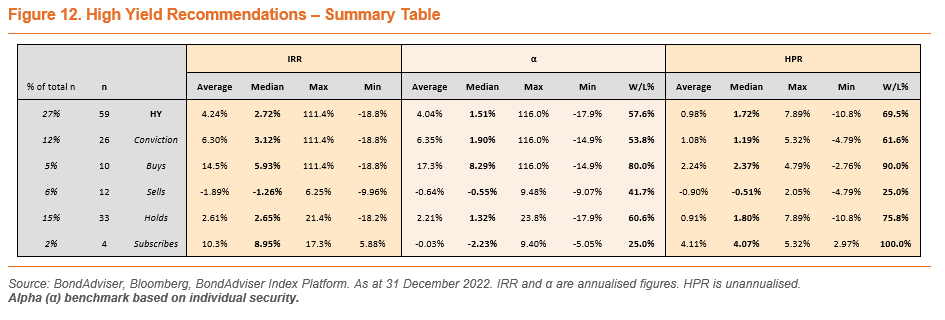
High Yield – Dislocations Provided for Strong Alpha Generation
Over the year, market dislocations arising from elevated fear and uncertainty saw attractive entry points from a spread perspective for credits with which we had fundamental comfort in. Whilst we appreciate liquidity is often difficult here, our Conviction recommendations performed exceptionally well on both an annualised basis and relative to respective benchmarks. Across our Buy recommendations, we generated an average alpha of 17.3% (2021: 6.6%), as well as an average IRR of 14.5% (2021: 10.2%).
Our best performing Buy call was on Centuria Secured Redeemable Notes (ASX: C2FHA), one of the few ASX-listed non-financial, non-hybrid bonds, off the back of a material widening in spreads during peak mania mid-to-late June. This drove the credit spread to be in excess of 6% at one point for a secured bond, which we identified to be a large dislocation considering its seniority up the capital structure and our relative comfort in the Issuer at those levels of credit risk. As a result, we booked an exceptional 111.4% Conviction IRR, equating to a 4.8% HPR over a three week holding period.
Our weakest Conviction recommendation posted an IRR of -18.8% (on an annualised basis) on Crown’s CWNHB – a hybrid we have had a love-hate relationship with in the past – equating to a -2.76% HPR and -14.86% alpha.
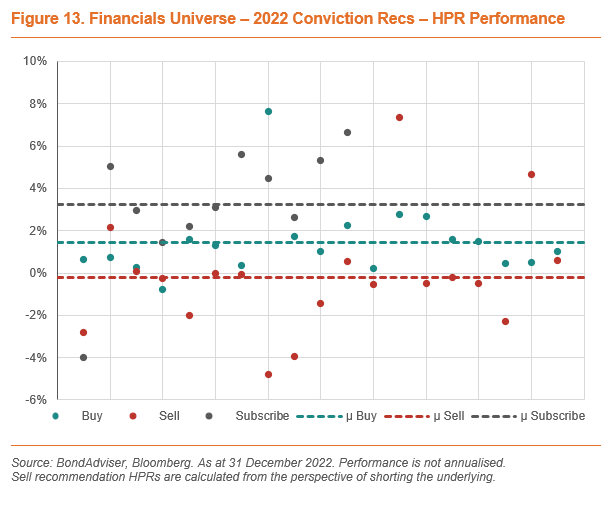
Financials (Banks, Insurers and Div Fins)
While performance results in this section include AT1 hybrids, discussion of such individual security returns is in the following section.
Performance across our Financials (senior unsecured, subordinated, regulatory capital) was varied over 2022. Despite a negative year for equities (oftentimes translating to poor performance in AT1 hybrids given their returns are more correlated than less risky bonds), many of our poor performing recommendations were on Sell recommendations. These were largely spread across non-AT1 securities (Tier 2, senior, and corporate hybrids) where we do not change recommendations as frequently as that of AT1 securities, which skews the data to larger HPRs compared to AT1 securities.
One of our strongest (non-AT1) calls was a Buy recommendation on Australian Unity’s (ASX: AYU) listed senior unsecured issue AYUHD, producing a 42.5% IRR, equating to a 40.5% alpha over the BAFRN0 index (HPR: 7.6%).
We held an overweight tilt to Tier 2 for much of 2021 and this was well rewarded. Some of the best recommendations in the Tier 2 space came from QBE Insurance Group’s (ASX: QBE) 10NC5 2036, NAB’s chronically undervalued NABPE, and a riskier position in AMP’s 10NC5 2027, which respectively provided IRRs of 9.3%, 6.7%, and 4.9%.
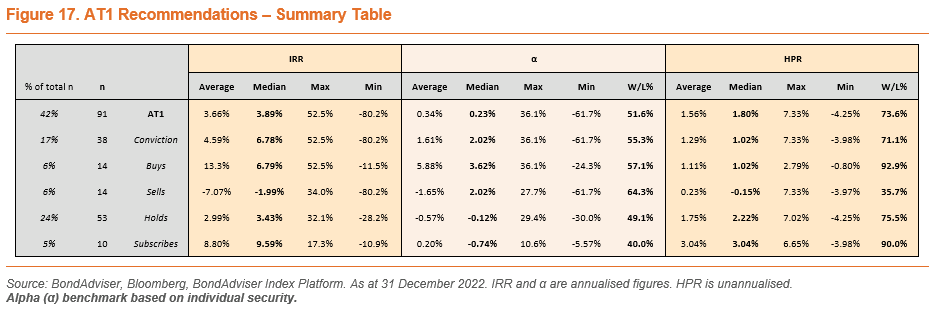
AT1s – New Issue Concessions Providing the Goods
The year began with all-time tights in spreads across the AT1 space on a post-Basel III basis (since 1-Jan-13), with our B4 AT1 Index ending 31 December 2021 with a 1.79% trading margin. Our house view at this point was to underweight this space, however we remained happy taking opportunistic positions where we identified market dislocations arising from fear and uncertainty, and on a relative value basis.
Utilising our proprietary rich/cheap quantitiative technology, we were able to generate an average IRR alpha of 5.5% over the course of 2022 across our 15 Buy recommendations in the AT1 space. On a Conviction basis (including Subscribe and Sell recommendations), this was 1.6% – offset by weak performance against benchmarks on our Sell recommendations.
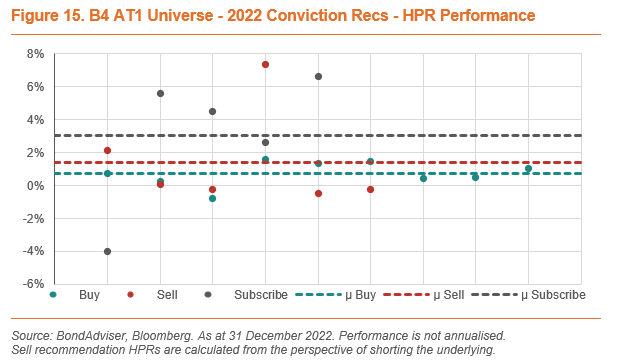
All but one of our Subscribe recommendations performed exceptionally well, with spread tightening post-issuance occurring as a function of (1) new issues generally being priced with a concession to secondary-traded securities, and (2) additional demand in the secondary markets from retail investors post-DDO regime after being locked out of IPO participation. Although these are not the only reasons for strong performance post-IPO, they are large contributors. Taking these factors into account, we were able to generate a 3.0% and 8.8% average HPR and IRR respectively across our 10 AT1 Subscribe recommendations.
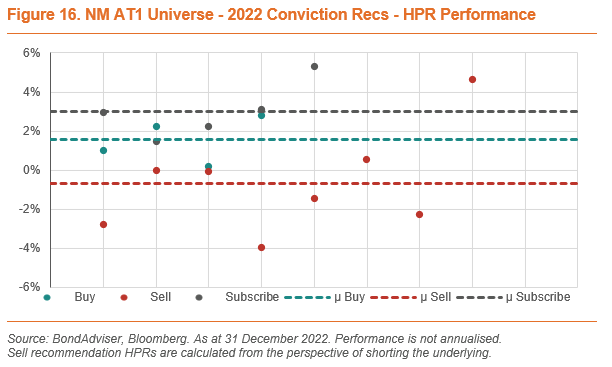
Contrarily, our Sell position initiated on SUNPG upon viewing the security to be rich on a relative value basis against comparable spaces, performed poorly. We recorded a -80.2% IRR here as investors continued to buy the security until it tightened to a credit spread of -1.4% (yes, negative). This indicates investors would be compensated less than the equivalent swap rate (which is essentially risk-free).
We view this to be somewhat irrational and reflective of a less efficient market base. Retail investors often purchase securities without full knowledge of the impact of higher prices on credit spreads, and therefore may not entirely understand compensation for risk in this market.
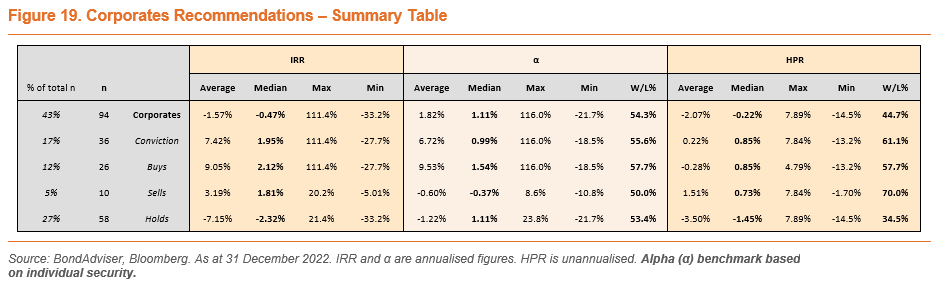
Corporates – Three Sigma Events Plentiful (Ironically)
Domestically, many companies across the Corporates sphere issue fixed-rate bonds as a way of hedging their interest expenses, which leads to a naturally duration-heavy space to invest in. As a result, although a security may be attractive on a relative basis; volatile and rising rate expectations meant large swings in capital prices depending on macro events driving inflationary expectations – making it particularly hard to have conviction despite confidence in company fundamentals. Across our Buy recommendations in the Corporates space, we generated a 9.53% average IRR alpha, although this was heavily skewed upwards by a small set of incredibly strong, short-dated calls on a relative basis.
Big wins were posted across Aurizon (ASX: AZJ) bonds with 68.9% and 75.9% Conviction IRRs across two Buy recommendations. This was matched with -25.6% and -28.4% IRRs across two Hold recommendations, highlighting the volatility present over the year.
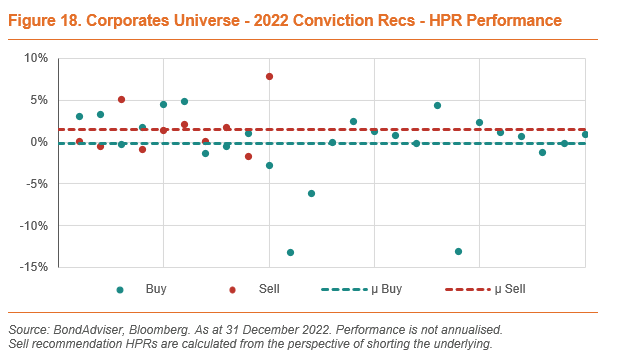
This performance was unfortunately not matched across all recommendations, with -13.2% and -13.1% HPRs recorded across Buy recommendations on duration-heavy bonds GPT 2.85% 2032 and SCA 2.45% 2029. Although we liked the value against the secondary-traded bonds at the time, one silver lining to our recommendation was opting to hedge duration risk, which would have mitigated losses resulting from rising rates. If only accounting for spread movement (i.e assuming a constant swap rate), the GPT HPR would have been -4.8% by our calculations.
Despite securities across the Corporates space taking a beating across the year, 61.1% of our recommendations produced a positive holding period return, with negative skew present as some duration-heavy securities fell significantly in price.
Click here to continue viewing the full set of data and charts.